当前位置:网站首页>Draw QQ charts with different distribution
Draw QQ charts with different distribution
2022-04-21 07:08:00 【Zhuang Shanshan's R language manual】
brief introduction
In this paper, we need to plot the data under different distribution assumptions QQ chart . Here, Xiaobian mainly uses qqplotr Package to draw , Reference blog :An Introduction to qqplotr.
Simple version
Draw a normal distribution of QQ chart
For the classical normal distribution QQ chart , You may not be new , And you can find a lot on the Internet “ Carry ” Of Chinese tweets . But the explanation is not very clear .
Here I take an example from this blog , To introduce :
1. Load package
library(qqplotr)
library(ggplot2)
2. Randomly generate data
set.seed(0)
smp <- data.frame(norm = rnorm(100))
3. Draw a normal distribution of QQ chart
gg <- ggplot(data = smp, mapping = aes(sample = norm)) +
    stat_qq_band() +
    stat_qq_line() +
    stat_qq_point() +
    labs(x = "Theoretical Quantiles", y = "Sample Quantiles")
gg

- expand
Here is a simple expansion , If you want to use different confidence bands to construct confidence intervals , You can use parameters bandType Adjustment . The following code gives the results of three different methods to construct confidence intervals . And use viridis package , Modify its color matching .
library(viridis)
gg <- ggplot(data = smp, mapping = aes(sample = norm)) +
    geom_qq_band(bandType = "ks", mapping = aes(fill = "KS"), alpha = 0.9) +
    geom_qq_band(bandType = "ts", mapping = aes(fill = "TS"), alpha = 0.9) +
    geom_qq_band(bandType = "pointwise", mapping = aes(fill = "Normal"), alpha = 0.9) +
    geom_qq_band(bandType = "boot", mapping = aes(fill = "Bootstrap"), alpha = 0.9) +
    stat_qq_line() +
    stat_qq_point() +
    labs(x = "Theoretical Quantiles", y = "Sample Quantiles") +
    scale_fill_viridis(discrete = T,direction = -1)

gg

Advanced version
The reader draws a normal distribution of QQ chart , It's still relatively simple . But what about other distributions ?
Here is a Reliability data As an example , The data comes from the literature :Badar, M. G., Priest, A. M. (1982). Statistical aspects of fiber and bundle strength in hybrid composites. In: Hayashi, T., Kawata, K., Umekawa, S., eds. Progress in Science and Engineering Composites. Tokyo: ICCM-IV, pp. 1129–1136.
data = data.frame('y' = c(1.339, 1.434, 1.549, 1.574 ,1.589, 1.613, 1.746 ,1.753, 1.764 ,1.807, 1.812, 1.84, 1.852, 1.852, 1.862, 1.864, 1.931, 1.952, 1.974, 2.019, 2.051, 2.055, 2.058 ,2.088, 2.125, 2.162, 2.171, 2.172 ,2.18 ,2.194 ,2.211 ,2.27, 2.272, 2.28, 2.299, 2.308, 2.335 ,2.349 ,2.356 ,2.386, 2.39, 2.41, 2.43, 2.431, 2.458, 2.471, 2.497, 2.514 ,2.558, 2.577, 2.593, 2.601, 2.604, 2.62 ,2.633, 2.67, 2.682, 2.699, 2.705, 2.735, 2.785, 2.785,3.02, 3.042, 3.116, 3.174))
Plot the exponential distribution QQ chart
Here we first plot the exponential distribution of QQ chart . After fitting the data according to the parameters of the exponential function , obtain rate =2.2867, And save it to list in .
How to fit , Readers search by themselves R Related functions in the package .
Other codes remain basically the same , Mainly is to stat_qq_line() and stat_qq_point() Under the distribution setting in , Under parameter setting .
# exponential distribution
dp <- list(rate = 2.2867)
di <- "exp"
p1 = ggplot(data = data, mapping = aes(sample = y)) +
  stat_qq_band(distribution = di, dparams = dp) +
  stat_qq_line(distribution = di, dparams = dp) +
  stat_qq_point(distribution = di, dparams = dp) +
  labs(x = "Theoretical Quantiles", y = "Sample Quantiles") +
  theme_bw() +
  theme(panel.grid = element_blank())
p1

Plot the Weibull distribution QQ chart
Empathy , Apply this data to Weibull distribution . give the result as follows :
# weibull distribution
di <- "weibull" # exponential distribution
dp <- list(shape=5.4766,scale=2.4113)
p2 = ggplot(data = data, mapping = aes(sample = y)) +
  stat_qq_band(distribution = di, dparams = dp) +
  stat_qq_line(distribution = di, dparams = dp) +
  stat_qq_point(distribution = di, dparams = dp) +
  labs(x = "Theoretical Quantiles", y = "Sample Quantiles") +
  theme_bw() +
  theme(panel.grid = element_blank())
p2

You can see that this dataset is more suitable for Weibull The distribution is fitted , The fitting result of exponential distribution is worse . Readers can use other distributions to fit , And compare the corresponding QQ chart , Find the most suitable distribution .
Then put these QQ chart Merge together , Through visual comparison .
Use here cowplot package , Merge the two figures . Xiaobian has made several issues of introduction to the package , so : . There are other ways to merge :.
#  Merge two  QQ  chart
library(cowplot)
plot_grid(p1, p2, ncol = 2, nrow = 1)

版权声明
本文为[Zhuang Shanshan's R language manual]所创,转载请带上原文链接,感谢
https://yzsam.com/2022/04/202204210605537325.html
边栏推荐
- 每日网安认证测试题(2022年4月13日)
- win10 系统重装后,如何恢复mysql 数据库(mysql-8.0.26-winx64.zip)
- Qt 动态链接库的创建和使用
- Qt 信号与槽connect()的连接方式和emit 返回值
- Text classification with Bert on colab
- 2、 1 [FPGA] initial FPGA
- 在 Win10系统,所有程序默认都以管理员身份运行
- Qt TableWidget插入QComboBox下拉框
- ESP32 LVGL8.1 ——checkbox 复选框 (checkbox 23)
- Realization of character relationship visualization and question answering system in a dream of Red Mansions based on Knowledge Map
猜你喜欢

ESP32 LVGL8.1 ——textarea 文本区域 (textarea 26)
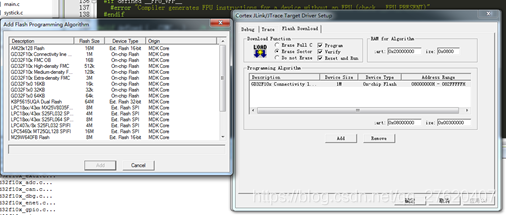
GD单片机Keil环境搭建

Reproduce the 3D density function diagram in the top issue of SCI
![2、 5 [FPGA] simple combinational logic - Design decoder](/img/a8/bc1dbca27ac6bb4dd4dafc2b286760.png)
2、 5 [FPGA] simple combinational logic - Design decoder

《数字电子技术基础》4.3 若干常用的组合逻辑电路 学习笔记
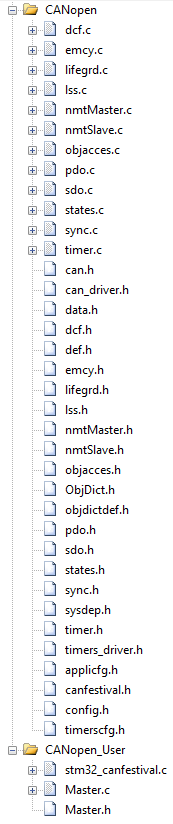
CANopen STM32移植

使用随机梯度下降法进行深度网络的学习

2、 Signal filtering > mean filtering and median filtering

深度学习环境搭建——Anaconda(搭配VScode使用)及TensorFlow-GPU版本安装

Spark性能优化指南
随机推荐
3. 事务和视图
Qt TableWidget插入QComboBox下拉框
ESP32 LVGL8.1 ——slider 滑动条 (slider 22)
ESP32 LVGL8.1 ——bar 进度条 (bar 21)
CISSP认证每日知识点(2022年4月12日)
const关键字、变量、函数用const修饰
I2C protocol (II): I2C pull-up resistance calculation
STM32 interrupt trigger logic
ESP32 LVGL8.1 M5Stack + LVGL + IDF 详细的移植教程 (27)
每日网安认证测试题(2022年4月15日)
第五章 支持向量机(SVM)
Realization of character relationship visualization and question answering system in a dream of Red Mansions based on Knowledge Map
MNIST數據轉化為numpy數組格式的詳細步驟與講解
每日CISSP认证常错题(2022年4月12日)
电脑内网外网同时访问-解决办法
Qt 动态链接库的创建和使用
搭建自己的blog
3、 5 switch level modeling of basic knowledge of Verilog HDL
logrotate 文件切割 权限问题
ESP32 LVGL8.1 ——btn 按钮 (btn 15)