当前位置:网站首页>[Reading Notes - > statistics] 07-01 introduction to the concept of discrete probability distribution geometric distribution
[Reading Notes - > statistics] 07-01 introduction to the concept of discrete probability distribution geometric distribution
2022-04-22 04:55:00 【Xiaoming 2766】
Discrete probability distribution
Geometric distribution
A situation : Chad likes skiing , But the technology is not good . Slide from the top of the mountain to the bottom of the slope , The probability of no accident is 0.2( Assuming Chad doesn't improve ). If he's going to keep trying , Until it's done . After the first success , He will stop skiing .
So what is the probability that he will successfully slide to the bottom of the slope if he tries to slide once or twice ?
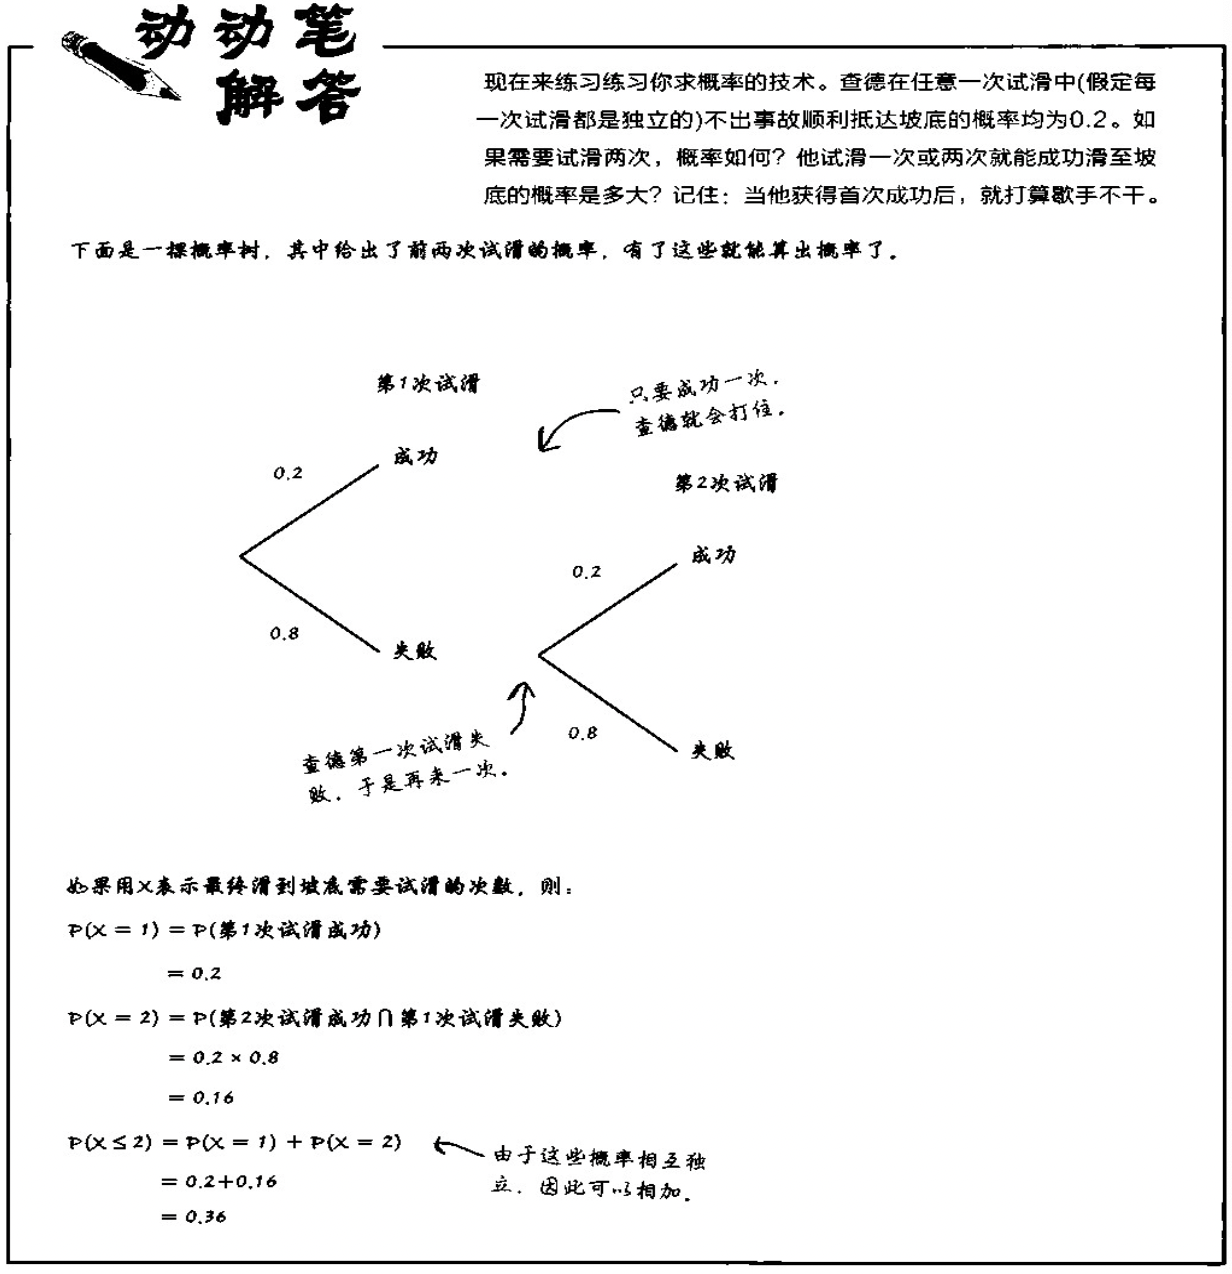
Then if he can try endless times , How many times will he succeed ? We can deduce ( You can imagine the probability tree ,0.8 It's a case of failure ):

there r Is the value of the deduction , and x Is any value in the probability distribution , Don't confuse the two .
You can see , Chaddy r The probability of success is :
P ( X = r ) = 0. 8 r − 1 ∗ 0.2 P(X=r) = 0.8^{r-1}*0.2 P(X=r)=0.8r−1∗0.2
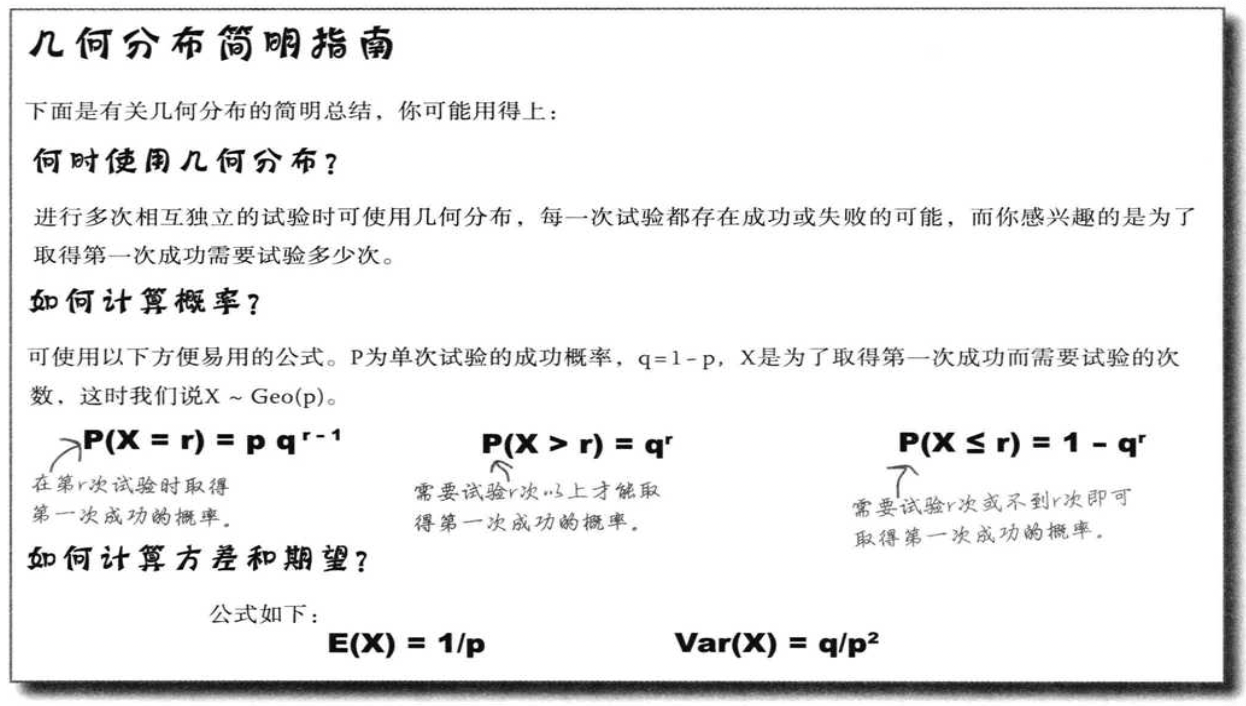
Let's summarize . If you use p Represents the success probability of a single test slip , The probability of failure is 1-p, We call this probability q, Therefore, any probability with this property can be calculated by the following formula :
P ( X = r ) = q r − 1 p P(X=r)=q^{r-1}p P(X=r)=qr−1p
This formula is called probability Geometric distribution .
The geometric distribution contains the following conditions :
- Go through a series of Are independent of each other Test of .
- Every experiment has the possibility of success , There is also the possibility of failure , And the success probability of a single test is the same .
- Your main interest is , How many experiments are needed to achieve the first success .
If the above conditions are met in the case of seeking probability , Then you can use the formula of geometric distribution to help you make a quick decision .
Tips : there “ success ” It means Events of interest to us Become a fact . If the events we want to see have negative implications , From a statistical point of view , This negative event can still be regarded as a “ success ” event .
To find out X Take a specific value r Probability , The following formula can be used for fast calculation :
P ( X = r ) = p q r − 1 P(X=r)=pq^{r-1} P(X=r)=pqr−1
among p For the probability of success ,q=1-p Is the probability of failure . namely , For the first time r The experiment was successful , First, fail (r-1) Time .
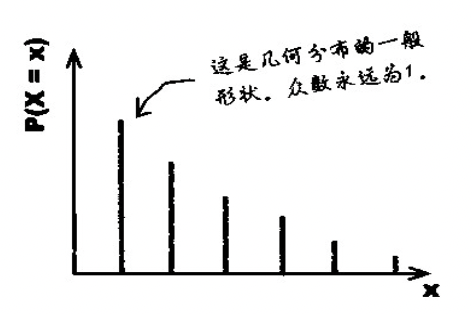
When r=1 when ,P(X=r) To the maximum , With r increase ,P(X=r) Gradual decline . It means that the probability of success is the greatest in the first experiment .
Geometric distribution in the case of inequality
The number of tests is greater than r, Means before r This time must fail .
P ( X > r ) = q r P(X>r) = q^r P(X>r)=qr
that , In order to achieve a success, you need to try r Time or r The following probability :
∵ P ( X ≤ r ) + P ( X > r ) = 1 ∴ P ( X ≤ r ) = 1 − P ( X > r ) = 1 − q r \because P(X \leq r)+P(X>r) = 1 \\ \therefore P(X \leq r) = 1-P(X>r) = 1 - q^r ∵P(X≤r)+P(X>r)=1∴P(X≤r)=1−P(X>r)=1−qr
If a variable X The probability of conforms to the geometric distribution , And the success probability of a single test is p, You can write :
X ∼ G e o ( p ) X \sim Geo(p) X∼Geo(p)
The expected pattern of geometric distribution
Previously, we have calculated the number of times Chad needs to try to slide to the bottom of the slope , But what about expectation and variance ? When mathematical expectations are known , We can get Chad's expectation of the number of test slides before he succeeds .
The expected formula is E ( X ) = ∑ x P ( X = x ) E(X)=\sum xP(X=x) E(X)=∑xP(X=x), In this case, there are infinite probabilities . however , We can calculate the first few values first , See if there is some fixed pattern .
Here is x The first few values of , among X~Geo(0.2)

The first 3 Columns are intermediate values , The value represents x P ( X = x ) xP(X=x) xP(X=x). But in x=5 When , The value is the highest . The first 4 Columns are expectations . When x Greater than 5 when , The first 3 Column - The median is getting smaller and smaller . There is little to change expectations later .
Here's number one 4 Column ( x P ( X ≤ x ) = ∑ x P ( X = x ) xP(X\leq x) = \sum xP(X=x) xP(X≤x)=∑xP(X=x) = expect ) The graphic :

take xP(X=x) The cumulative sum of ( expect ) After drawing a figure , It can be seen that , With x Bigger , Expect to get closer and closer to a specific value :5( I understand it : With x More and more , The ordinate is getting closer and closer 5). After countless tests ( A great deal of x【 Not very “ Big ” Of x】) after ,xP(X=x) Cumulative total of ( That is, expectations ) Exactly equal to 5, namely E ( X ) = 5 E(X)=5 E(X)=5.
The meaning of the above formula is very intuitive : The probability of success of a single test is 0.2, It can be understood as 5 One of the attempts tends to succeed , So we can expect Chad to try 5 You can succeed once .
The above situation can be generalized to any value p. If X~Geo§, be :
E ( X ) = 1 p E(X) = \frac{1}{p} E(X)=p1
Variance of geometric distribution
Premise : Fang Bad = V a r ( X ) = E ( X 2 ) − E 2 ( X ) variance =Var(X)=E(X^2)-E^2(X) Fang Bad =Var(X)=E(X2)−E2(X)
Look at the table below , The first 4 The column is x 2 P ( X ≤ x ) = E ( X 2 ) = ∑ x 2 P ( X = x ) x^2P(X\leq x)=E(X^2) = \sum x^2 P(X=x) x2P(X≤x)=E(X2)=∑x2P(X=x), The first 3 Column is x 2 P ( X = x ) x^2 P(X=x) x2P(X=x).
[ Failed to transfer the external chain picture , The origin station may have anti-theft chain mechanism , It is suggested to save the pictures and upload them directly (img-VhBVS1tn-1650331163542)( Discrete probability distribution .assets/image-20220415220708530.png)]
stay x achieve 10 Before and after , x 2 P ( X = x ) x^2P(X=x) x2P(X=x) Increase first and then decrease .

So if you find the variance , The variance formula is : V a r ( X ) = E ( X 2 ) − E 2 ( X ) Var(X)=E(X^2)-E^2(X) Var(X)=E(X2)−E2(X), According to the... Of the previous figure 4 The expected square of the column sum and the previous figure , Subtracting the , You can find the variance . At this time, draw another one by x A growing image ,

With x Bigger , x 2 P ( X ≤ x ) − E 2 ( X ) x^2P(X\leq x)-E^2(X) x2P(X≤x)−E2(X) Getting closer to a specific value , Here is 20.
Just like when discussing mathematical expectations , The law of variance can be summarized as follows . If X~Geo§, be
V a r ( X ) = q p 2 Var(X) = \frac{q}{p^2} Var(X)=p2q
Summary of geometric distribution
ask : Why does geometric distribution use p and q?
answer :p Stands for English words “probability”, namely “ probability ”, In geometric distribution , It represents the success probability of a single test .q In statistics, it often represents 1-p, That is to say p’. These letters will appear in large numbers in this chapter and later in this book .
Example ,“ success ” Events for “ Successfully slide to the bottom of the slope ”.

版权声明
本文为[Xiaoming 2766]所创,转载请带上原文链接,感谢
https://yzsam.com/2022/04/202204210737542935.html
边栏推荐
- 2022t elevator repair test questions and online simulation test
- Spark 入門程序 : WordCount
- If you can convert a two-dimensional array into a one-dimensional array gracefully and quickly, or convert a multi-dimensional array into a one-dimensional array
- Sharing of enterprise data leakage prevention scheme
- Performance analysis of PostgreSQL limit
- How the CPU calls the process
- 6. Comparable to JMeter Net pressure measurement tool - crank practical chapter - collecting diagnosis tracking information and how to analyze bottlenecks
- The role and risk of setsql using lamdbaupdatewrapper
- Prediction of KNN Iris species after normalization and standardization
- Deployment of web server, personal experience
猜你喜欢

2022.04.20 Huawei written examination

Transaction isolation level and mvcc

Vue project NPM run build when packaging the project, time stamp the version number of CSS and JS files to prevent the browser from caching

Iris species prediction -- Introduction to data set
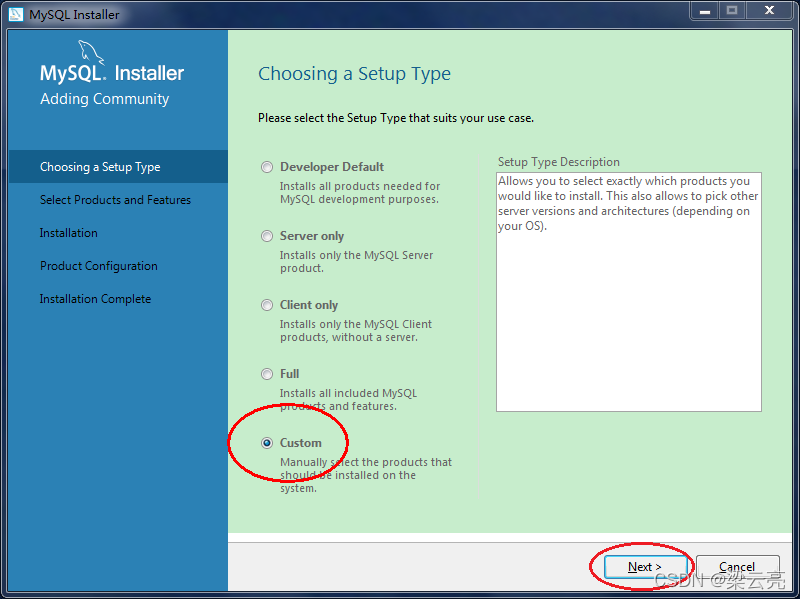
Uninstallation, installation and setting of MySQL

博云 BeyondCMP 云管理平台 5.6 版本发布

Linear regression API

Linear regression of machine learning

Sharing of enterprise data leakage prevention scheme

Rsync overview
随机推荐
rpc error: code = Unavailable desc = error reading from server: EOF
Leetcode refers to offer 43 Number of occurrences of 1 in integers 1 ~ n***
How the CPU calls the process
vue项目 npm run build 打包项目时为css、js文件加时间戳版本号,防止浏览器缓存
Overview of over fitting and under fitting treatment methods of linear regression
[untitled]
Linear regression API
[chestnut sugar GIS] ArcMap - how to combine multiple images into one
What is the maximum length that can be set for the bitmap of redis? Why is the maximum length bit that can be set 2 ^ 32? How to calculate how much space the bitmap will occupy
Rookie's counter attack
【板栗糖GIS】supermap—如何為數據制造超鏈接
资源 ACCP-S1 BOOK3开发工具的下载
JVM - G1 garbage collector
Chapter IV constraints and indexes
在线预览PDF文件功能实现
Leetcode sword finger offer 15 Number of 1 in binary
Boyun beyondcmp cloud management platform version 5.6 release
ObjectBox使用记录
What is the difference between two-dimensional convolution kernel and three-dimensional convolution kernel in convolution neural network?
All conditions that trigger epollin and epollout