当前位置:网站首页>Elk installation
Elk installation
2022-04-23 15:14:00 【A run】
Reference resources thank you https://zhuanlan.zhihu.com/p/107346014?from_voters_page=true
Other problems modify container memory :https://www.cnblogs.com/xiaohanlin/p/11800337.html
View container log :docker attach --sig-proxy=false Containers id
docker pull filebeat:7.6.0 Not installed
ELK yes Elasticsearch、Logstash、Kibana For short , These three are the core Suite , But not all .
Elasticsearch It's a real-time full-text search and analysis engine , Provide collection 、 analysis 、 Three functions of data storage ; It's a set of openness REST and JAVA API And other structures provide efficient search function , Scalable distributed systems . It is built on Apache Lucene On top of the search engine library .
Logstash It's a collection of 、 analysis 、 Tools for filtering logs . It supports almost any type of logging , Include system logs 、 Error logs and custom application logs . It can receive logs from many sources , These sources include syslog、 The messaging ( for example RabbitMQ) and JMX, It can output data in a variety of ways , Including email 、websockets and Elasticsearch.
Kibana It's based on Web Graphical interface of , Used to search 、 Analysis and visualization are stored in Elasticsearch Log data in metrics . It USES Elasticsearch Of REST Interface to retrieve data , Not only allow users to create customized dashboard views of their own data , They are also allowed to query and filter data in special ways
One 、 Reference material
- Official website address
- http://mirrors.aliyun.com/centos
- https://github.com/medcl/elasticsearch-analysis-ik/releases
- https://www.cnblogs.com/William-Guozi/p/elk-docker.html
- https://www.cnblogs.com/peterpoker/p/9573720.html
- https://www.cnblogs.com/just-coder/p/11017050.html
Two 、 Download related docker Mirror image
docker pull elasticsearch:7.6.0
docker pull kibana:7.6.0
docker pull logstash:7.6.0
docker pull filebeat:7.6.0
docker pull mobz/elasticsearch‐head:5
3、 ... and 、 build ELK Log system
Create a elk Folder , The following configuration files are put in it
mkdir /home/elk3.1 install elasticsearch
Create a elasticsearch.yml file
vi /home/elk/elasticsearch.ymlAdd the following configuration :
cluster.name: "docker-cluster"
network.host: 0.0.0.0
#  visit ID limit ,0.0.0.0 For no limit , Please set the production environment to fixed IP
transport.host: 0.0.0.0
# elasticsearch The name of the node
node.name: node-1
# elasticsearch Node information
cluster.initial_master_nodes: ["node-1"]
#  The following configuration is to turn off cross domain authentication
http.cors.enabled: true
http.cors.allow-origin: "*"
Create and launch elasticsearch Containers
docker run -di -p 9200:9200 -p 9300:9300 --name=elasticsearch -v /home/elk/elasticsearch.yml:/usr/share/elasticsearch/config/elasticsearch.yml elasticsearch:7.6.0After through 9200 The port is in the browser range , If there is information returned, it will succeed
Be careful : If you need to add a plug-in, map the plug-in directory of the container to the actual path or use the command ( If installed ik Word segmentation is :
docker cp ik elasticsearch:/usr/share/elasticsearch/plugins/) Copy it to the container
Possible problems
1. After successful startup , After a while, it stopped
This is related to the configuration we just modified , because elasticsearch There will be some checks at startup , For example, the maximum number of open files and virtual memory
Number of areas, etc , If you release this configuration , It means you need to open more files and virtual memory , So we also need system tuning .
- modify /etc/security/limits.conf , Add the following :
* soft nofile 65536 - * hard nofile 65536
nofile Is the maximum number of files allowed to be opened by a single process soft nofile Soft restriction hard nofile Hard constraints
- modify /etc/sysctl.conf, Additional content
vm.max_map_count=655360
Limit what a process can have VMA( Virtual memory area ) The number of
Execute the following command Changes to kernel parameters take effect immediately , Then restart the server and docker service
sysctl ‐p2. The startup fails and the following log information is displayed
ERROR: [1] bootstrap checks failed
[1]: the default discovery settings are unsuitable for production use; at least one of [discovery.seed_hosts, discovery.seed_providers, cluster.initial_master_nodes] must be configured
This is because elasticsearch7 Is the multi node version of the cluster , Need to be in elasticsearch.yml Add the following configuration :
# elasticsearch The name of the node
node.name: node-1
# elasticsearch Node information
cluster.initial_master_nodes: ["node-1"]
3. The Internet has been able to pass 9200 Query port and push data , But later installed kibana And other components cannot be connected
Check the log and find the following error
error=>"Elasticsearch Unreachable: [http://192.168.6.128:9200/][Manticore::...This problem is usually due to the... Installed on a machine docker Containers , When the firewall is on ,docker The host service cannot be accessed inside the container ( Services that can access other LAN computers that are not host computers ), resolvent :
- Configure firewall rules firewall-cmd --zone=public --add-port={port}/tcp --permanent, And reload firewall rules firewall-cmd --reload
- Use... When starting the container --net host Pattern (docker Of 4 Network mode :https://www.jianshu.com/p/22a7032bb7bd)
- Turn off firewall
install elasticsearch‐head Plug in for debugging ( Can not be installed )
docker run ‐di ‐‐name=es-head ‐p 9100:9100 mobz/elasticsearch‐head:5Access after startup success 9100 Port can be managed by interface elasticsearch.
Install... On your local computer
- download head plug-in unit :https://github.com/mobz/elasticsearch-head
- take grunt Install as a global command .Grunt Is based on Node.js Project building tools . It can automatically run what you need Set tasks
npm install ‐g grunt‐cli - Installation dependency
npm install - start-up
grunt server
Open the browser , Input http://localhost:9100
3.2 install kibana
kibana Mainly used in relation to elasticsearch Analyze and view the data . Note that the selected version must be the same as elasticsearch The version of is the same or lower , Recommendations and elasticsearch The same version of , Otherwise you will not be able to use kibana.
Create a kibana.yml The configuration file , Write the following configuration in it :
server.port: 5601
server.host: "0.0.0.0"
elasticsearch.hosts: ["http://elasticsearch Of IP:9200"]
#  Language setting of operation interface
i18n.locale: "zh-CN"
Create and launch kibana Containers
docker run -di --name kibana -p 5601:5601 -v /home/elk/kibana.yml:/usr/share/kibana/config/kibana.yml kibana:7.6.0Access after startup success 5601 The port can enter kibana Management interface .( After entering, it is required to select the configuration , Just choose to browse by yourself )
Add index configuration
Install this first logstash Then come back to operate ; Input log* You can choose logstash Log information , After the creation is successful, you can view the log information
3.3 install logstash
Create a logstash.conf The configuration file , Add the following configuration :
input {
    tcp {
        port => 5044
        codec => "plain"
    }
}
filter{

}
output {
    #  This is logstash The console print ( Start of installation and debugging , You can remove this configuration later )
    stdout {
        codec => rubydebug
    }
    # elasticsearch To configure
    elasticsearch {
        hosts => ["elasticsearch Of IP:9200"]
    }
}
Create and launch logstash Containers
docker run -di -p 5044:5044 -v /home/elk/logstash.conf:/usr/share/logstash/pipeline/logstash.conf --name logstash logstash:7.6.0Push the micro service log to logstash in
add to maven rely on
<dependency>
        <groupId>net.logstash.logback</groupId>
        <artifactId>logstash-logback-encoder</artifactId>
        <version>6.3</version>
    </dependency>
Let's say springboot in logback As a log , The configuration file (logback-spring.xml) The configuration information is as follows :
<?xml version="1.0" encoding="UTF-8"?>
<configuration>
    <!--  Console output  -->
    <appender name="STDOUT" class="ch.qos.logback.core.ConsoleAppender">
        <layout class="ch.qos.logback.classic.PatternLayout">
            <pattern>%d{yyyy-MM-dd HH:mm:ss.SSS} [%thread] %highlight(%-5level) %cyan(%logger{50}.%M.%L) - %highlight(%msg) %n</pattern>
        </layout>
    </appender>
    <!--logback Output -->
    <appender name="STASH" class="net.logstash.logback.appender.LogstashTcpSocketAppender">
        <destination>192.168.6.128:5044</destination>
        <includeCallerData>true</includeCallerData>
        <encoder class="net.logstash.logback.encoder.LogstashEncoder">
            <includeCallerData>true</includeCallerData>
            <providers>
                <timestamp>
                    <timeZone>UTC</timeZone>
                </timestamp>
                <pattern>%d{yyyy-MM-dd HH:mm:ss.SSS} [%thread] %-5level %logger{80}.%M.%L - %msg %n</pattern>
            </providers>
        </encoder>
    </appender>

    <root level="INFO">
        <!-- Local development debugging will open the console output , At the same time, close the log file output , Improve log performance ; For online deployment, be sure to turn off the console output -->
        <appender-ref ref="STDOUT"/>
        <appender-ref ref="STASH"/>
    </root>
</configuration>
版权声明
本文为[A run]所创,转载请带上原文链接,感谢
https://yzsam.com/2022/04/202204231407312922.html
边栏推荐
- Set onedrive or Google drive as a drawing bed in upic for free
- js——实现点击复制功能
- Brute force of DVWA low -- > High
- JUC learning record (2022.4.22)
- [proteus simulation] automatic range (range < 10V) switching digital voltmeter
- API gateway / API gateway (III) - use of Kong - current limiting rate limiting (redis)
- Leetcode167 - sum of two numbers II - double pointer - bisection - array - Search
- 分布式事务Seata介绍
- Three uses of kprobe
- async关键字
猜你喜欢
Sword finger offer (2) -- for Huawei

大文件如何快速上传?
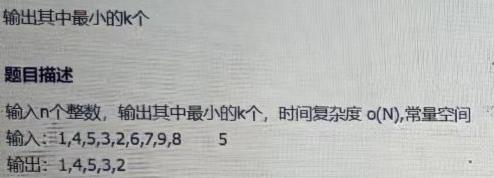
Byte interview programming question: the minimum number of K

LeetCode165-比较版本号-双指针-字符串
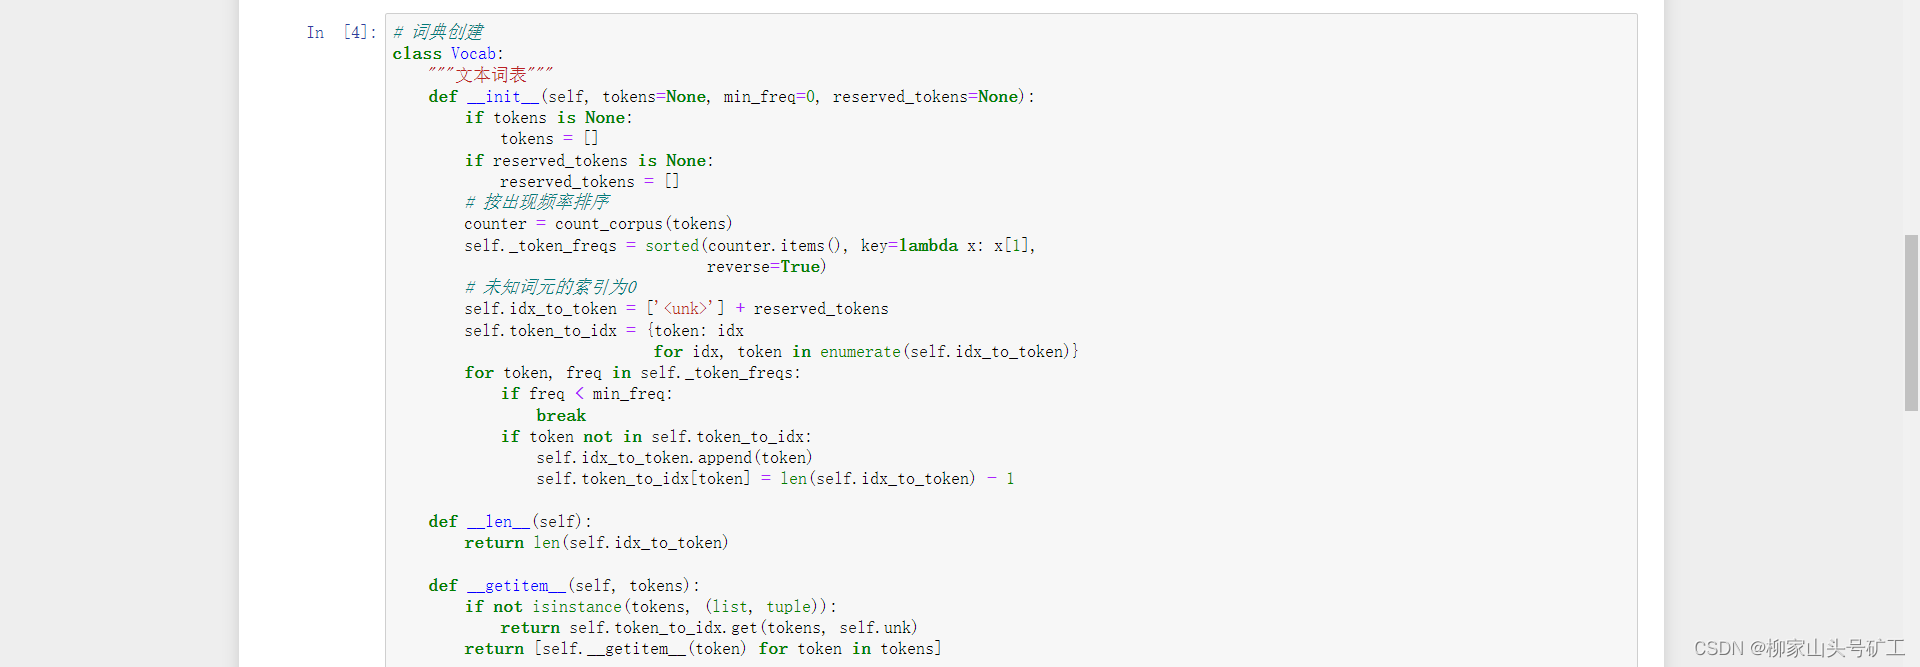
8.2 text preprocessing
On the day of entry, I cried (mushroom street was laid off and fought for seven months to win the offer)
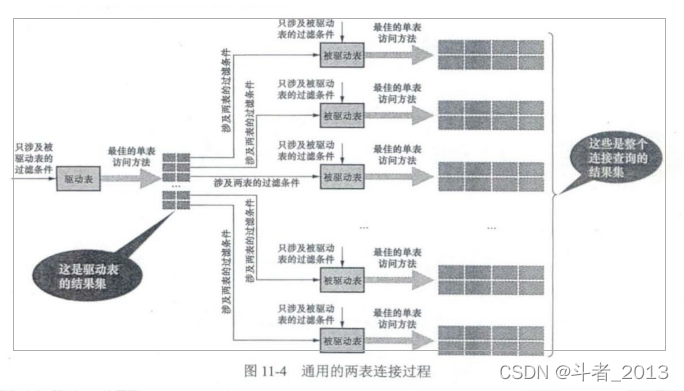
Mysql连接查询详解
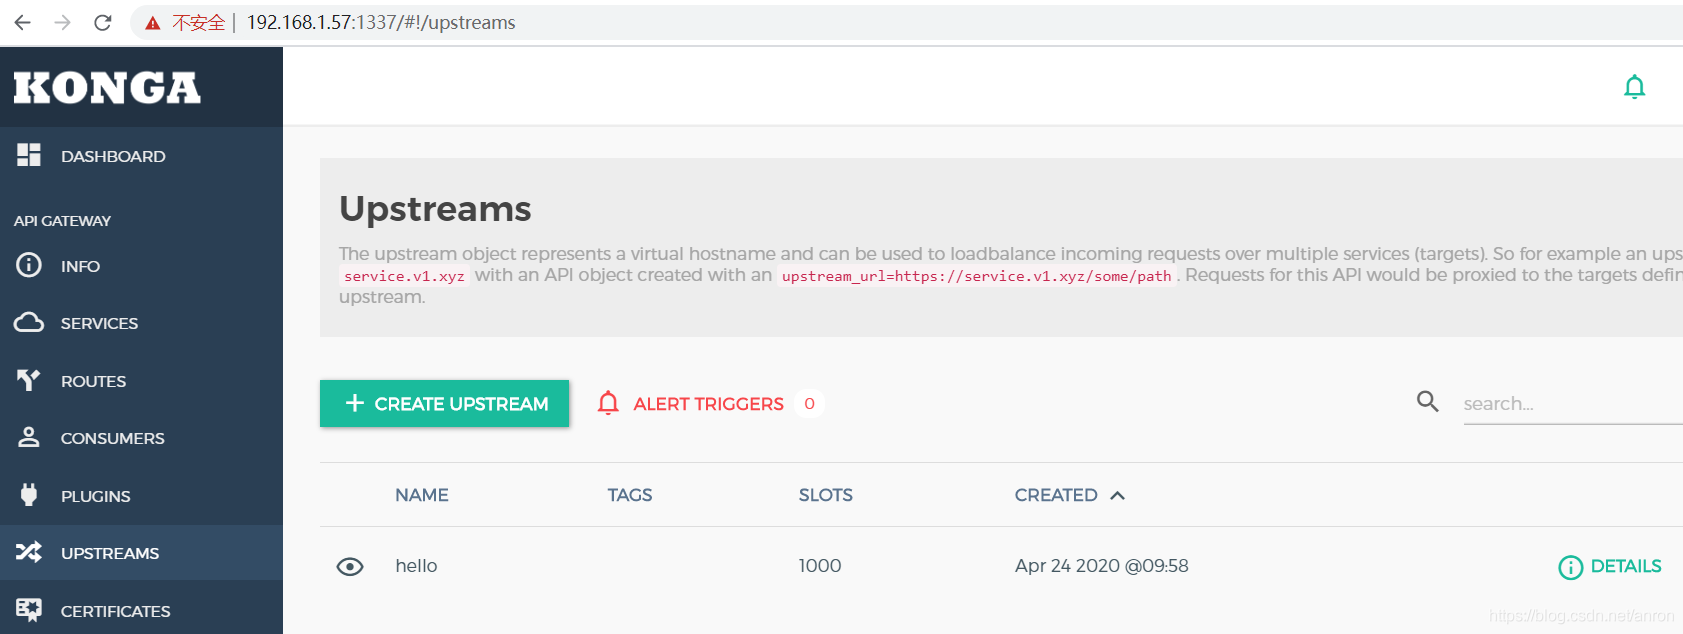
API gateway / API gateway (II) - use of Kong - load balancing
Leetcode165 compare version number double pointer string
thinkphp5+数据大屏展示效果
随机推荐
Is asemi ultrafast recovery diode interchangeable with Schottky diode
Borui data and F5 jointly build the full data chain DNA of financial technology from code to user
A series of problems about the best time to buy and sell stocks
Grep was unable to redirect to the file
How to write the keywords in the cover and title? As we media, why is there no video playback
HJ31 单词倒排
Detailed analysis of SQL combat of Niuke database (26-30)
Flink DataStream 类型系统 TypeInformation
Leetcode153 - find the minimum value in the rotation sort array - array - binary search
C language super complete learning route (collection allows you to avoid detours)
X509 certificate cer format to PEM format
Ffmpeg installation error: NASM / yasm not found or too old Use --disable-x86asm for a clipped build
Nacos program connects to mysql8 0+ NullPointerException
Kubernetes详解(九)——资源配置清单创建Pod实战
Mysql连接查询详解
Detailed explanation of C language knowledge points - data types and variables [2] - integer variables and constants [1]
Alexnet model
LeetCode167-两数之和II-双指针-二分-数组-查找
中富金石财富班29800效果如何?与专业投资者同行让投资更简单
What is the effect of Zhongfu Jinshi wealth class 29800? Walk with professional investors to make investment easier