当前位置:网站首页>logistic regression model - based on R
logistic regression model - based on R
2022-08-08 14:00:00 【Ah Qiangzhen】
logistic回归模型—基于R
logistic回归又称logistic回归分析,是一种广义的线性回归分析模型,常用于数据挖掘,疾病自动诊断,经济预测等领域.例如,探讨引发疾病的危险因素,并根据危险因素预测疾病发生的概率等.以胃癌病情分析为例,选择两组人群,一组是胃癌组,一组是非胃癌组,两组人群必定具有不同的体征与生活方式等.因此因变量就为是否胃癌,值为“是”或“否”,自变量就可以包括很多了,如年龄、性别、饮食习惯、幽门螺杆菌感染等.自变量既可以是连续的,也可以是分类的.然后通过logistic回归分析,可以得到自变量的权重,从而可以大致了解到底哪些因素是胃癌的危险因素.同时根据该权值可以根据危险因素预测一个人患癌症的可能性.
Data understanding and preparation
library(MASS)
data(biopsy)
biopsy

数据集包含699tissue samples from patients,保存在11个变量的数据框中,如下所示:
- ID:样本编码
- V1:cell concentration
- V2:Cell size uniformity
- V3:细胞形状均匀度
- V4:Edge adhesion
- V5:单上皮细胞大小
- V6:naked nucleus(16observations are indeed)
- V7:Peaceful chromatin
- V8:normal nucleoli
- V9:mitotic state
- class:Tumor diagnosis results,良性或恶性:This is the outcome variable we want to predict
First delete the code of the sample
biopsy$ID=NULL
一. 对缺失值的处理
Due to missing values only16个,account for all observations2%,So we just need to remove the missing values
biopsy <- na.omit(biopsy)
Of course, you can also use interpolation to deal with missing values
See this article on handling missing values
二.Assignment of dummy variables
考虑将class的两个类别malignant,benign分别赋值为1,0
通过ifelse函数来实现
y <- ifelse(biopsy$class=="malignant",1,0);y
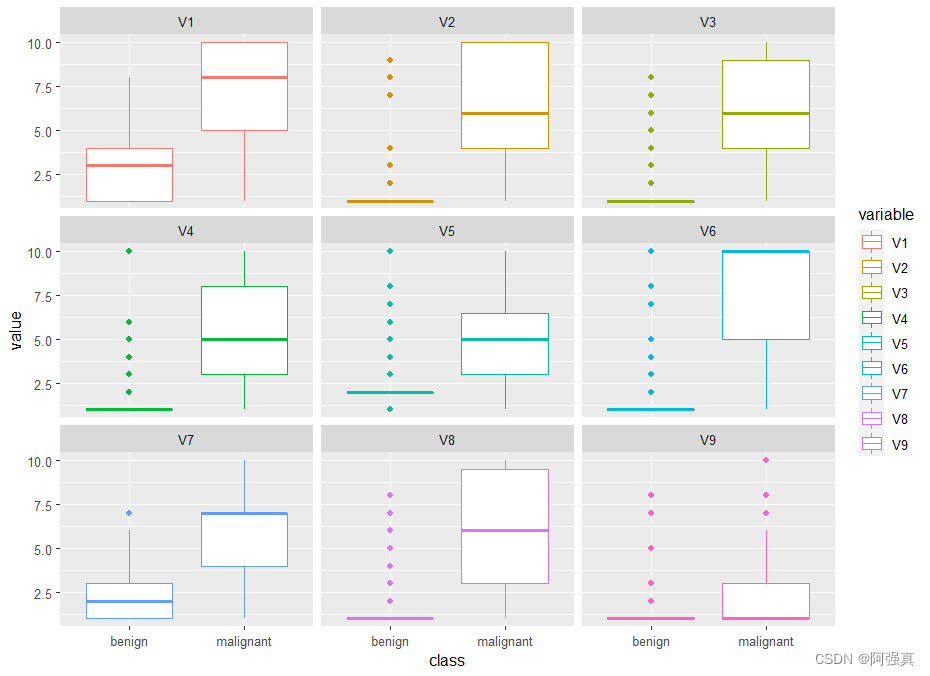
三.箱线图
library(tidyverse)
library(reshape2)
biopsy1 <- melt(biopsy,id.var="class");biopsy1
#箱线图
ggplot(biopsy1,aes(class,value))+geom_boxplot(aes(color=variable))+
  facet_wrap(~variable,ncol=3)
四.相关性分析
library(corrplot)
cor(biopsy[,1:9])%>% corrplot.mixed()

从相关系数可以看出,We will have a collinearity problem,特别是V2和V3The correlation coefficient between is as high as 0.91,showed obvious collinearity
训练集与测试集的划分
There are various ways to properly partition the data into training and test sets:50/50,60/40,70/30,80/20,诸如此类.You should choose your own experience and judgment to choose how to divide the data.在本例中,I choose to follow70/30proportion of the data.如下所示
set.seed(123)
ind <- sample(2,nrow(biopsy1),replace = T,prob=c(0.7,0.3))
ind
train <- biopsy[ind==1,];train
test <- biopsy[ind==2,];test
To ensure that the outcome variables of the two datasets are balanced,We do the following checks
table(train$class)
table(test$class)
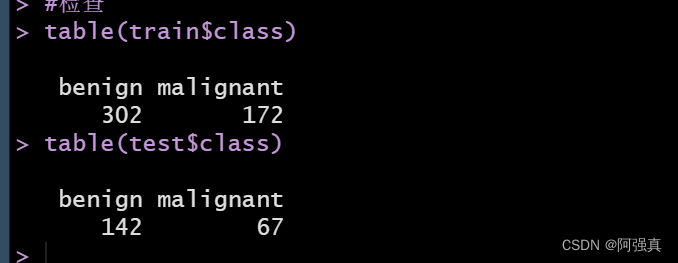
This internal ratio is acceptable
模型构建与评价
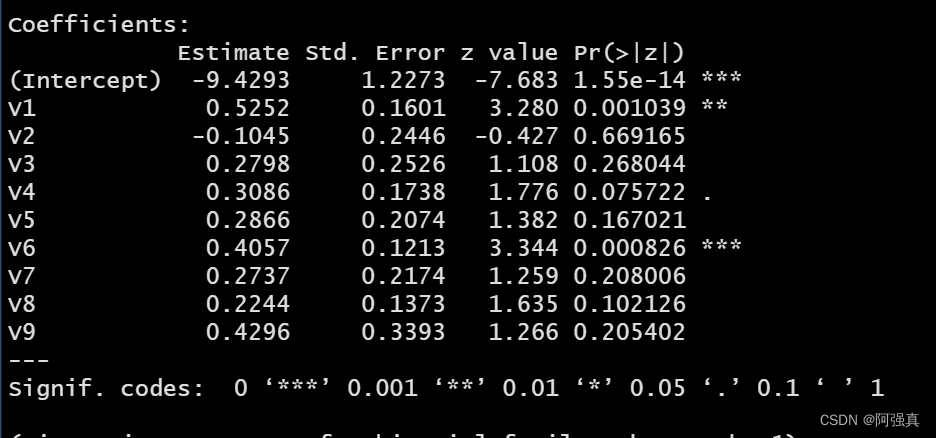
一.logistic回归模型
fit <- glm(class~.,family=binomial,data=train)
summary(fit)
#Check for multicollinearity
library(car)
vif(fit)
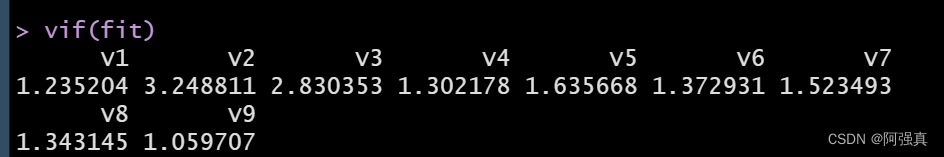
由于vif值都小于5,The effect of multicollinearity can be excluded
二.Check how the model performs on the training and test datasets
The first thing to do is to build a vector to represent the predicted probability:
train.probs <- predict(fit,type="response")
The next step is to evaluate the performance of the model on the training set,Then evaluate how well it fits on the test set.
这时我们需要0和1来表示,The default value used by the function to differentiate between benign and malignant results is 0.5,也就是说,当概率大于0.5时,The result is considered to be malignant
train.probs <- predict(fit,type="response")
train.probs <- ifelse(train.probs >=0.5,1,0)
trainy <- y[ind==1]
testy <- y[ind==2]
#install.packages("caret")
library(caret)
confusionMatrix(table(trainy, train.probs))

On the diagonal is our prediction error value:
error=(7+8)/474;error
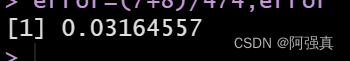
It can be seen that the prediction error rate is 0.03
Next, the performance of the data on the test set:
testy <- y[ind==2]
length(testy)
test.probs <- predict(fit,newdata=test,type="response") #注意这里是newdata
test.probs <-  ifelse(test.probs>=0.5,1,0)
length(test.probs)
confusionMatrix(table(testy, test.probs))
error1 <- (2+3)/209;error1
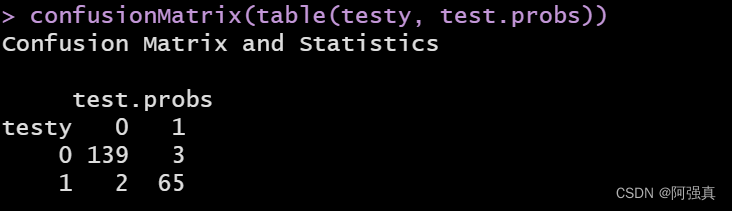
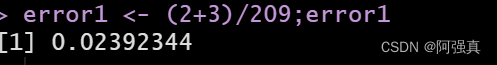
It can be seen that the prediction error rate is only 0.02
使用交叉验证的logistic回归
交叉验证
For the raw data we will divide a part of ittrain data,part is divided intotest data.train data用于训练,test datafor testing accuracy.在test dataThe result of the above test is calledvalidation error.Apply an algorithm to a raw data,We can't just make a random partition oncetrain和test data,然后得到一个validation error,Just as a standard to measure the quality of this algorithm.Because there is chance.We have to do random partitions many timestrain data和test data,Calculate their respective on itvalidation error.So there is a groupvalidation error,根据这一组validation error,It can better and accurately measure the quality of the algorithm.
Logistic 回归详解 交叉验证概念
我们将用bestglm包进行交叉验证
install.packages("bestglm")
library(bestglm)
X <- train[,1:9]
XY <- data.frame(cbind(X,trainy))
bestglm(Xy=XY,IC="BIC",family=binomial)
在上面的代码中.Xy=XYRefers to our already formatted data frame,IC="BIC"Tell the program that the information criterion we use is cross-validation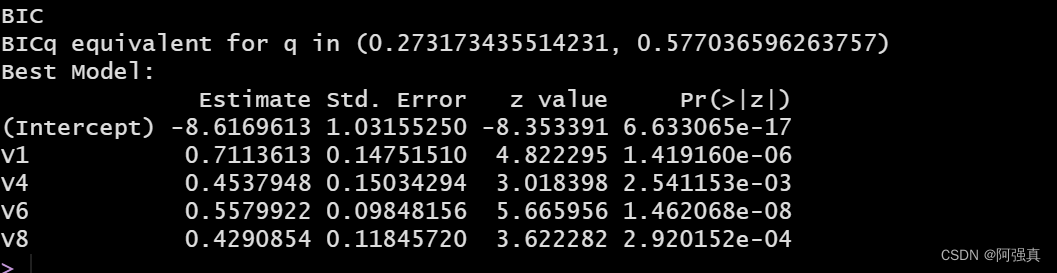
接下来看看BICThe prediction effect of the optimal subset algorithm
bicfit <- glm(class~V1+V4+V6+V8,family=binomial,data=train)
test.bic.probs <- predict(bicfit,family=binomial,newdata=test,
                          type="response")
test.bic.probs <- ifelse(test.bic.probs>=005,1,0)
confusionMatrix(table(testy,test.bic.probs))

You can see the correct rateACCURACY为0.97
边栏推荐
- itk中生成drr整理
- R语言ggplot2可视化:使用ggpubr包的ggtexttable函数可视化表格数据(直接绘制表格图或者在图像中添加表格数据)、使用tab_add_hline函数为表头添加横线并自定义线条宽度
- 腾讯,投了个 “离诺贝尔奖最近的华人”
- Ingress:比Service更强大的服务暴露与负载均衡
- webgl 基础
- 华为云会议初体验【华为云至简致远】
- R语言ggpubr包的ggsummarystats函数可视化分面箱图(通过ggfunc参数和facet.by参数设置)、添加描述性统计结果表格、palette参数配置不同水平可视化图像和统计值的颜色
- 变量和函数的声明提前
- Implement a customized pin code input control
- 【小码匠自习室】叛逆的小孩,打死也不改
猜你喜欢
【个人总结】2022.8.7周结

window停掉指定端口的进程

HackTheBox | Horizontall
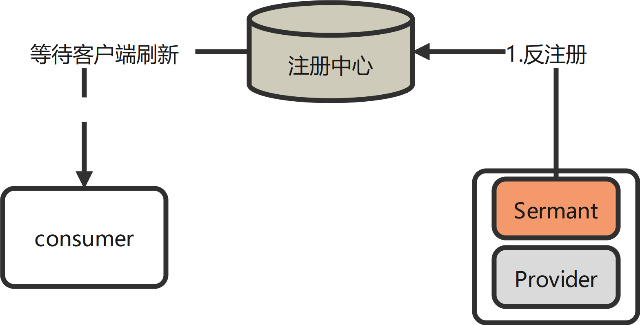
看到这个应用上下线方式,不禁感叹:优雅,太优雅了!
年初离职,学习半年源码,终于拿到了蚂蚁Offer,分享面试过程

干货满满,中科院信工所于静新课帮你get学术研究与论文写作技能

Harvard University smashes the field: DALL-E 2 is just a "glue monster", and the generation accuracy rate is only 22%

优刻得“失速”:营收转降,定向增发股东浮亏超三成

机器学习+深度学习笔记(持续更新~)
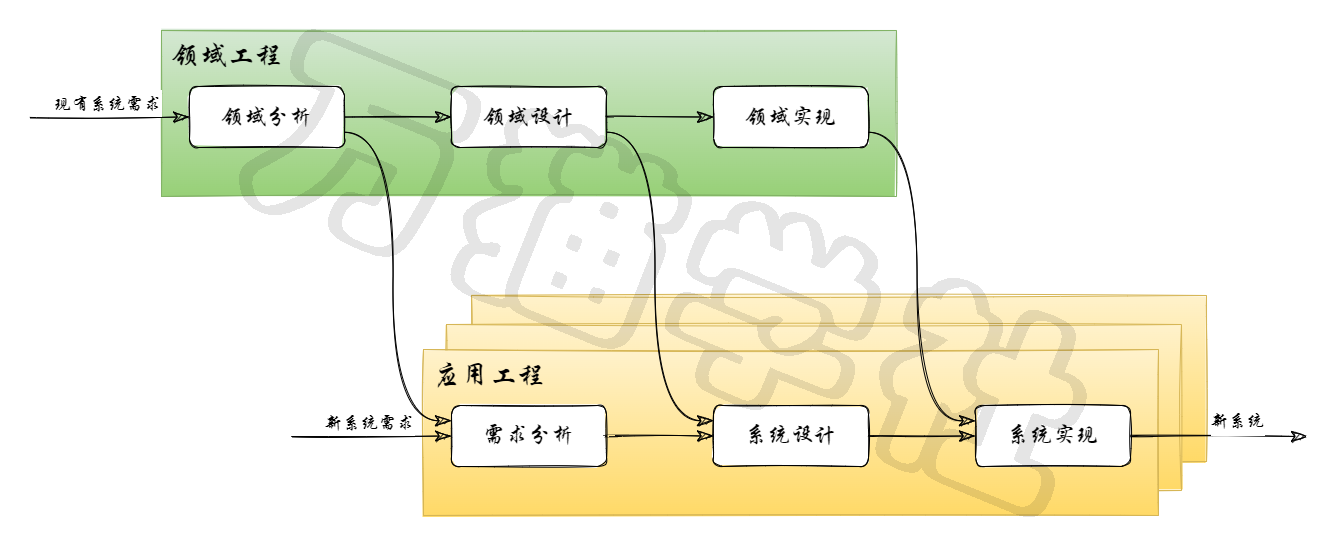
【软考 系统架构设计师】软件架构设计⑥ 软件产品线
随机推荐
itk中图像2d-3d配准整理
小白大白读论文-关于EfficientNetV2论文的 疑问 与 总结
R语言ggplot2可视化:使用ggpubr包的ggbarplot函数可视化堆叠的柱状图(stacked bar plot)、palette参数自定义不同水平柱状图边框以及填充的颜色
HackTheBox | Previse
UnsatisfiedDependencyException: Error creating bean with name ‘
年初离职,学习半年源码,终于拿到了蚂蚁Offer,分享面试过程
【小码匠自习室】ABC258-A 代码写的啰嗦了
复盘:什么是秋招提前批?什么是普通秋招?都是招聘,为啥要设置这两个招聘时间段
张一鸣挺进生育大业
HackTheBox | Horizontall
非科班毕业生,五面阿里:四轮技术面+HR一面已拿offer
leetcode 155. Min Stack最小栈(中等)
MySQL:锁机制 |表级锁、行级锁 | 排它锁、共享锁 | 间隙锁
itk中生成drr整理
Tensorflow与Keras进行机器学习、深度学习
难产的“第一股”:中式快餐之困
从零开始,如何拥有自己的博客网站【华为云至简致远】
poj3744 Scout YYF I
【小码匠自习室】让错误成为孩子进步的阶梯
LeetCode简单题之统计星号