当前位置:网站首页>Linear Regression in Machine Learning - Based on R
Linear Regression in Machine Learning - Based on R
2022-08-07 06:25:00 【Ah Qiangzhen】
机器学习中的线性回归——基于R
alr3The package seems to be no longer available for download,But you can use the data inside
链接:https://pan.baidu.com/s/1xg-V5nPulRf6Tvna26dlTQ?pwd=0s1u
提取码:0s1u
Data can be downloaded here,Use after downloading the dataRstudio打开就能使用,No need to load anything else
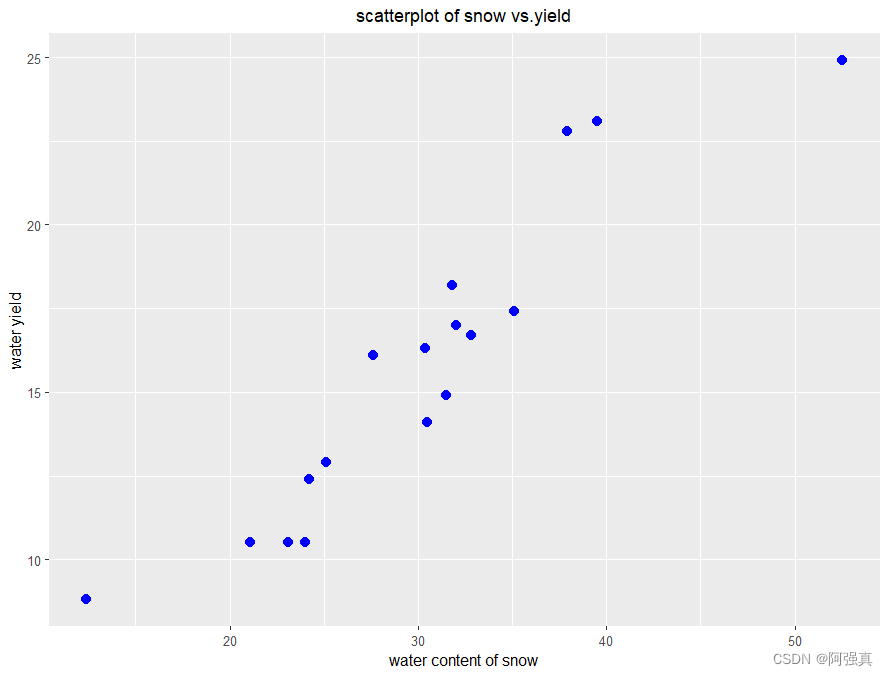
单变量回归
Predict the amount of water in the Snake River area of Wyoming 数据:snake
一.Data preparation operations,散点图
library(tidyverse)
snake
names(snake) <- c("content","yield")
a <- ggplot(snake,aes(content,yield))+
  geom_point(colour='blue',shape=19,size=3)+
  labs(x="water content of snow",
       y=" water yield ",
       title = "scatterplot of snow vs.yield")+
  theme(plot.title = element_text(size=12,hjust=0.5))
a
二.进行拟合
#用lmfunction for linear regression
yield.fit <- lm(yield~content,data=snake)
install.packages("flextable")
library(flextable)#Use this package to display the results
as_flextable(yield.fit)
#Add straight lines to the original scatterplot,Look at the fitting effect
intercept <- yield.fit$coefficients[[1]]
slope <-yield.fit$coefficients[[2]]
a+geom_abline(slope=slope,intercept=intercept,col='red',size=2)


三.residual test
#检验
par(mfrow=c(2,2))
plot(yield.fit)
#Normal with upper cornersQQThe figure shows that it basically obeys a normal distribution
#使用car包中的qqPlot函数检验
library(car)
par(mfrow=c(1,1))
qqPlot(yield.fit)


多变量线性回归
一.数据的预处理
数据集:water,The data is still in the link I shared above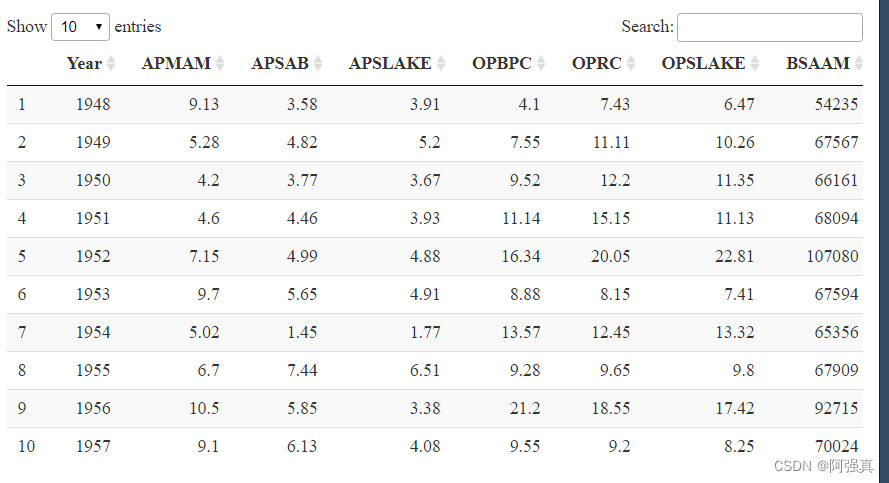
newdata <- water[,-1]#去掉第一列
#相关性的检查
library(corrplot)
correlation <- cor(newdata)
corrplot(correlation,method="ellipse")
#Build a scatterplot matrix
pairs(~.,data=newdata)


二.Model construction and evaluation
fit <- lm(BSAAM~.,data=newdata)
as_flextable(fit)

观察可以发现,有几个变量的t统计量p值明显大于0.05,Therefore, a stepwise regression method is considered to optimize the model
#优化
fit1 <- step(fit)
summary(fit1)
#Generate diagnostic plots
par(mfrow=c(2,2))
plot(fit1)
#方差膨胀因子
vif(fit1)
#BP检验
library(lmtest)
bptest(fit1)#p大于0.05Then accept the absence of heteroscedasticity
#预测:
newdata$forecast <- predict(fit1)
newdata
ggplot(newdata,aes(forecast,BSAAM))+
  geom_point()+geom_smooth(method="lm")+
  labs(title="Forecast versus Actuals")+
  theme(plot.title = element_text(size=20,hjust=0.5))
Stepwise regression results: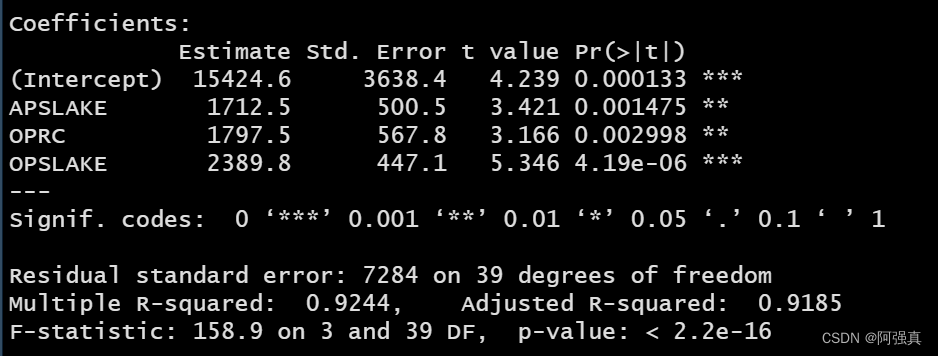
诊断图:
Variance inflation factor and BP检验:
Predicted and fitted values
Other problems in linear models
一.定性特征
It is actually a dummy variable,For example, gender equals male1,否则等于0
以ISLR包中的Carseats数据为例:
install.packages("ISLR")
library(ISLR)
data("Carseats")
str(Carseats)

在这个例子中,我们将预测sales变量,对于因子,RMetrics are automatically encoded at analysis time.Model establishment and analysis are shown below:
sale.fit <- lm(Sales~Advertising+ShelveLoc,data=Carseats)
summary(sale.fit)

二.交互项
数据集为MASS包中的Boston数据
library(MASS)
data("Boston")
Boston

建立medv(房屋价值)关于lstat(Percentage of low socioeconomic status households)和age(房屋年龄)Model with interaction terms
lm(medv~lstat*age,data=Boston) %>% summary()

to get the model:
medv=36-1.19lstat-0.0007age+0.004age*lstat
边栏推荐
猜你喜欢


随机推荐
LeetCode 1163. The last substring lexicographically
机器学习中的线性回归——基于R
使用IDEA作为开发工具,修改完项目中部分文件代码后,不起作用
数组扁平化
【井字棋】
This beta version of Typora is expired
支付宝支付
spyder/conda安装包报错:conda info could not be constructed. KeyError: ‘pkgs_dirs‘
VoLTE基础自学系列 | 什么是SIP和IMS中的Forking
Spark基础【运行架构、RDD】
LeetCode 1408. 数组中的字符串匹配
VoLTE basic self-study series | RTP and RTCP protocol principles
dagre/dagre-d3绘制流程图
Alibaba Cloud Deployment
微信支付学习笔记
2022A特种设备相关管理(电梯)特种作业证考试题库模拟考试平台操作
servlet 教程 2:返回 jsp 页面
[数组中等题] LeetCode 969. 煎饼排序
MyTinySTL的deque源码分析
关于面试