当前位置:网站首页>Example accumulation of two-dimensional line drawing function plot () in MATLAB
Example accumulation of two-dimensional line drawing function plot () in MATLAB
2022-04-22 12:58:00 【Haohong algorithm】
Catalog
1 plot(Y)
plot(Y) establish Y A two-dimensional line graph of each value index in the data .
If Y It's a vector ,x The scale range of the axis is from 1 to length(Y), The example code for this case is as follows :
t=1:0.1:10;
y=sin(t);
plot(y);
The results are shown in the following figure :
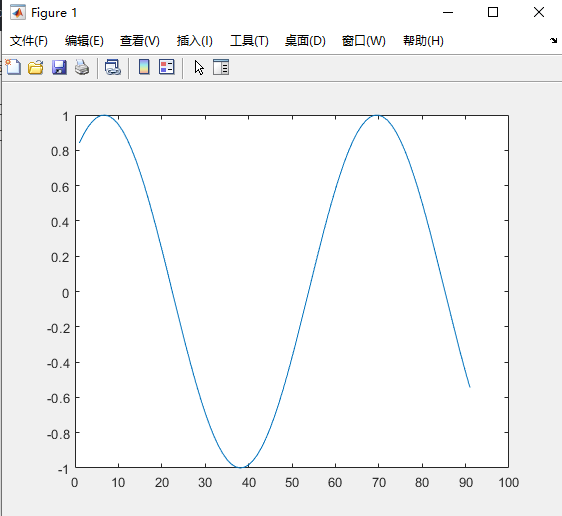
Be careful : The cross sitting range in the above is not [1,10] It is [1,91],[1,91] It's a vector y The index of , As shown in the figure below :

If Y It's a matrix , be plot Function to draw Y The diagram of the row number of each column in the .x The scale range of the axis is from 1 To Y The number of rows . The example code for this case is as follows :
Y=[1 2 3;4 5 6;7 8 9;10 11 12];
plot(Y);

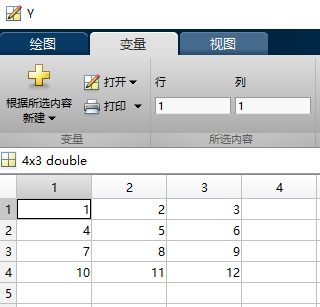
As can be seen from the above two pictures , The blue line in the figure is the... Of the matrix 1 Column , The red line in the figure is the... Of the matrix 2 Column , The yellow line in the figure is the... Of the matrix 3 Column . A matrix has several columns and several lines .x The scale range of the axis is from 1 To Y The number of rows .
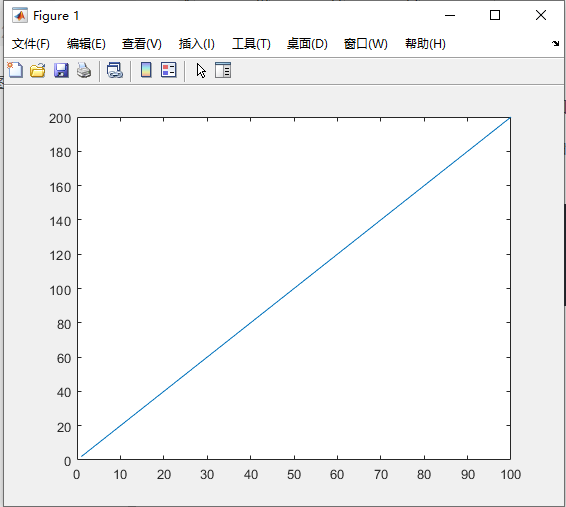
If Y It's the plural , be plot Function to draw Y The imaginary part of Y The graph of the real part of ( That is, the imaginary part is y Axis , The real part is x Axis ), bring plot(Y) Equivalent to plot(real(Y),imag(Y)). The example code for this case is as follows :
x=1:1:100;
y=2:2:200;
z=x+y.*1i;
plot(z);
The results are shown in the following figure :
2 plot(X,Y)
plot(X,Y) establish Y The data in Chinese is right for X Two dimensional line graph of corresponding values in .
If X and Y Is a vector , Then they have to be the same length .plot Function to draw Y Yes X Graph , namely X Is the horizontal axis ,Y For the vertical axis . The example code for this case is as follows :
x=0:0.1:10;
y=sin(x)+2;
plot(x,y);
The operation results are as follows :

If X and Y All are matrices , Then they have to be the same size .plot Function to draw Y The right of X The graph of the columns of the . namely X and Y Each column of is plotted as a curve , And take X Listed as x Axis ,Y Listed as y Axis . The example code for this case is as follows :
X=[1 6 11;2 7 12;3 8 13;4 9 14];
Y=[2 18 44;4 21 48;6 24 52;8 27 56];
plot(X,Y);
The results are shown in the following figure :


The blue line in the picture is X Matrix and Y Matrix No 1 The curve formed by column elements ; The red line is X Matrix and Y Matrix No 2 The curve formed by column elements ; The orange line is X Matrix and Y Matrix No 3 The curve formed by column elements .
If X or Y One of them is a vector and the other is a matrix , Then one dimension of the matrix must be equal to the length of the vector . If the number of rows of the matrix equals the length of the vector , be plot Function to draw a graph of each column of a matrix to a vector . If the number of columns of a matrix is equal to the length of the vector , Then the function draws the graph of each row in the matrix to the vector . If the matrix is square , Then the function draws the graph of each column pair of vectors . The example code for this case is as follows :
x=0:0.1:10;
y=[sin(x)+2;cos(x)+1];
plot(x,y);
The operation results are as follows :


As you can see from the results ,y The number of columns of a matrix is equal to the vector x The length of , So the first curve is the matrix y A line , And as a vector x Abscissa .
If X or Y One is scalar , And the other is scalar or vector , be plot Function draws discrete points . however , To see these dots , You must specify the markup symbol , for example plot(X,Y,‘o’). The example code for this case is as follows :
x=3;
y=0:1:10;
plot(x,y,'o')

3 plot(___,Name,Value)
This format is used to format lines , For example, the color of lines 、 Linetype 、 Point mark, etc .
The specific use method is : Specify optional 、 Separated by commas Name,Value For group parameters .Name For parameter name ,Value Is the corresponding value .Name Must be in quotation marks . You can specify multiple names in any order - Value pair group parameter , Such as Name1,Value1,…,NameN,ValueN Shown .
An example is as follows :
x=0:0.5:20;
y=sin(x);
plot(x,y,'color','[0 0 1]','Marker','+');
Running results :

The line formats that can be set here are as follows :
‘Color’ — line color
‘LineStyle’ — Linetype
‘Marker’— The sign
‘LineWidth’— Line width
‘MarkerIndices’— To display the index of the marked data point
‘MarkerEdgeColor’— Mark outline color
‘MarkerFaceColor’— Mark fill color
‘MarkerSize’— Tag size
DatetimeTickFormat’—datetime Format of scale label
‘DurationTickFormat’—duration Format of scale label
The first three are commonly used , That's line color 、 Linetype and marker symbols , The general optional parameters of these three are as follows :
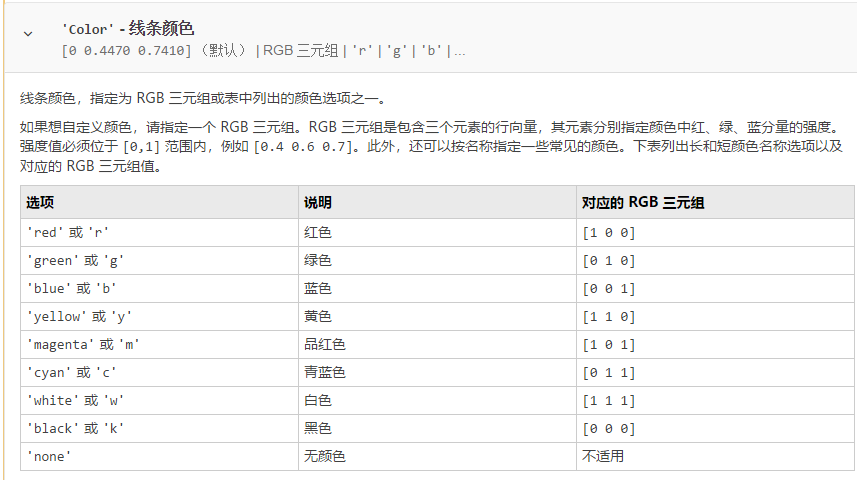


For optional parameters of other formats, please refer to MATLAB Help documentation for .
4 Axis dimensions and drawing titles
The main functions of marking the coordinate axis and adding title to the drawing are xlabel、ylabel zlabel and title etc. . Their calling formats are basically the same , It's also easy to use , Look at an example and you'll know how to use it .
x=1:0.1*pi:2*pi;
y=sin(x);
plot(x,y);
xlabel('x(0-2\pi)','fontweight','bold');
ylabel('y=sin(x)','fontweight','bold');
title(' Sine function ','fontsize',12,'fontweight','bold','fontname',' Song style ');

For more information about their format attribute settings, please refer to MATLAB Help document for .
5 Legend labels
We often encounter the situation of drawing multiple curves in one graph , In this case, we can use the function legend() Add a legend to the curves to distinguish them .
x = linspace(0,2*pi);
y1 = sin(x);
y2 = cos(x);
plot(x,y1,x,y2);
legend('sin(x)','cos(x)');
The operation results are as follows :

function plot() And the function legend() The use of is actually very flexible , Consider the following code :
x = linspace(0,2*pi);
y1 = cos(x);
plot(x,y1,'DisplayName','cos(x)')
hold on

y2 = cos(2*x);
plot(x,y2,'DisplayName','cos(2x)')
hold off

legend
The operation results are as follows :

6 at present MATLAB Your text already supports Latex Formula input
Like the following code :
x = 0:0.01:1;
y1= x.^(1/2.2);
y2 =x.^(2.2);
plot(x,y1,x,y2);
xlabel('V_{in}');
ylabel('V_{out}');
legend('\gamma=1/2.2','\gamma=2.2');
The operation results are as follows :

From the running results, we can see that , The subscripts are in the right place .“gamma” Also escaped as “γ”
版权声明
本文为[Haohong algorithm]所创,转载请带上原文链接,感谢
https://yzsam.com/2022/04/202204221255140515.html
边栏推荐
- Book city project registration page and email verification
- Is this open source project going to kill me?
- ORB_ Slam3 learning: introduction to tracking thread
- Get rid of the "small workshop" of AI production: how to build a cloud native AI platform based on kubernetes
- Under the pressure of sanctions, Russia plans to import electronic products in parallel through friendly countries
- 書城項目注册頁面和郵箱驗證
- Leetcode 1768, alternate merge string
- vnpy本地导入csv数据
- How to batch delete worksheets in Excel
- Sqlserver游标的使用
猜你喜欢

Let cpolar get a fixed TCP address

IDE Import Project

数商云电子招投标系统解决方案丨规范政采流程,提高工作效率

企业邮箱的边边角角

The R language uses the treemap function in the treemap package to visualize the treemap graph: treemap displays the hierarchical data as a group of nested rectangles, customized label color, label ba

VR panorama truly restores the driving school environment, and VR live shows the hard power of the driving school

11. Container with the most water

C#之SQL数据库操作(源码)

Verify whether the form is empty
Is this open source project going to kill me?
随机推荐
给自己成功的可能性
Use of sqlserver cursor
Leetcode 83. Delete duplicate elements in the sorting linked list
C#窗体的淡入淡出功能(项目工程源码)
C#自定义Button实现源码
Verify whether the form is empty
Under the pressure of sanctions, Russia plans to import electronic products in parallel through friendly countries
R language ggplot2 visualizes the custom sorting of x-axis factor variables instead of sorting in the default alphabetical order
数商云电子招投标系统解决方案丨规范政采流程,提高工作效率
OpenCV函数line()的参数pt1和pt2的类型要求
Leetcode 695. Maximum area of the island
利用OpenCV的函数threshold()对图像作基于OTSU的阈值化处理---并附比较好的介绍OTSU原理的博文链接
Day code 300 lines learning notes day 47
C#中如何将图片添加为程序的资源
R语言使用qnorm函数生成正太分布分位数函数数据、使用plot函数可视化正太分布分位数函数数据(Normal distribution)
redis 优缺点 使用场景
Daily question series: common substring calculation
Use R language_ Xlsx function export and write dataframe data to excel file
R language ggplot2 visualization: ggplot2 visualization moves the legend of the image to the inside of the image and customizes the location of the legend
ORB_ Slam3 learning: introduction to tracking thread