当前位置:网站首页>灵活好用的sql monitoring 脚本 part7
灵活好用的sql monitoring 脚本 part7
2022-08-09 06:59:00 【梦想家DBA】
81.Script: locked_objects_internal.sql
-- Description : Lists all locks on the specific object.
[[email protected] monitoring]$ cat locked_objects_internal.sql
-- -----------------------------------------------------------------------------------
-- File Name    : /monitoring/locked_objects_internal.sql
-- Author       : Maxwell
-- Description  : Lists all locks on the specific object.
-- Requirements : Access to the DBA views.
-- Call Syntax  : @locked_objects_internal (object-name)
-- Last Modified: 08-AUG-2022
-- -----------------------------------------------------------------------------------
SET LINESIZE 1000 VERIFY OFF

COLUMN lock_type FORMAT A20
COLUMN mode_held FORMAT A10
COLUMN mode_requested FORMAT A10
COLUMN lock_id1 FORMAT A50
COLUMN lock_id2 FORMAT A30

SELECT li.session_id AS sid,
       s.serial#,
       li.lock_type,
       li.mode_held,
       li.mode_requested,
       li.lock_id1,
       li.lock_id2
FROM   dba_lock_internal li
       JOIN v$session s ON li.session_id = s.sid
WHERE  UPPER(lock_id1) LIKE UPPER('%&1%');

SET VERIFY ON
[[email protected] monitoring]$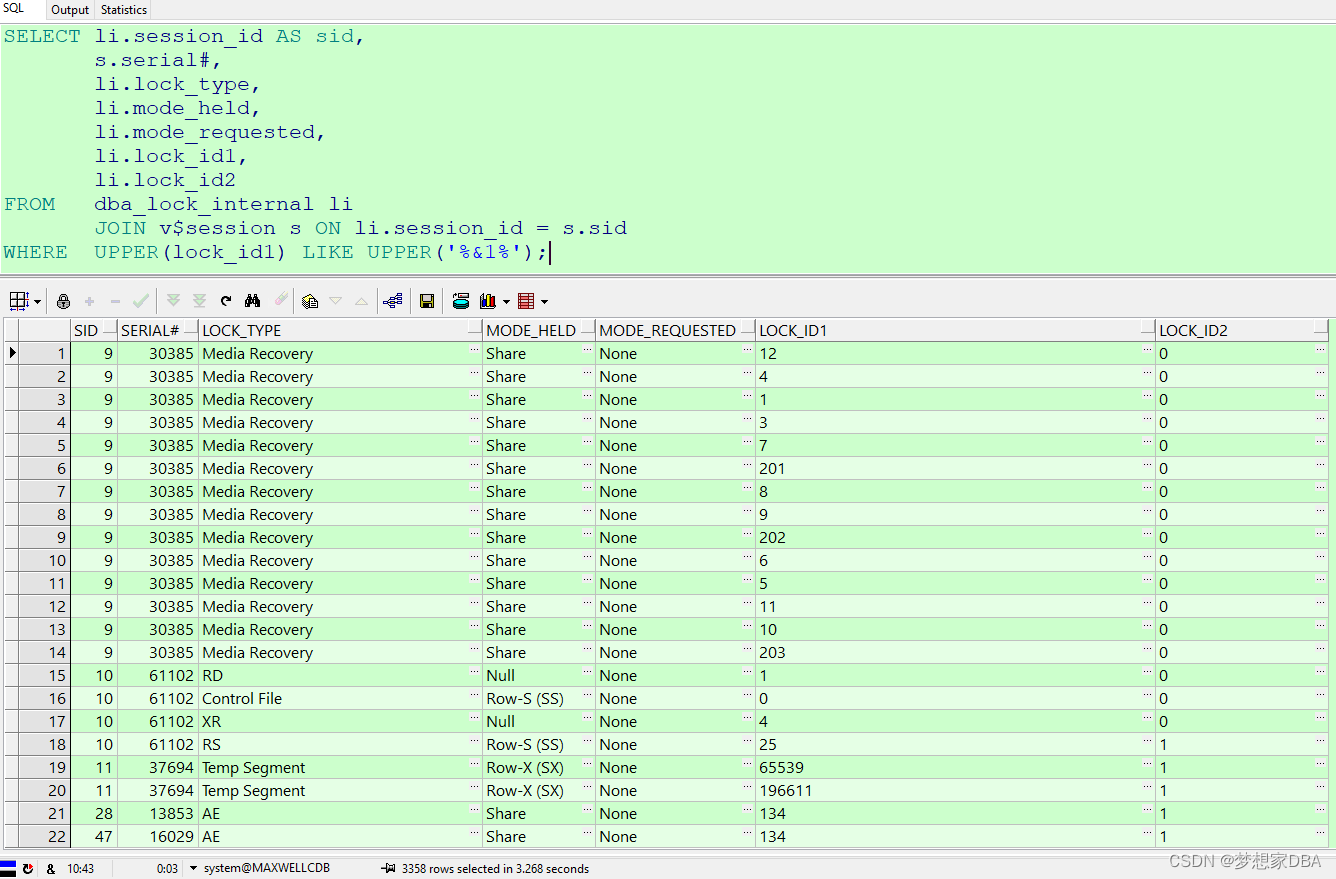
82.Script: logfiles.sql
-- Description : Displays information about redo log files.
[[email protected] monitoring]$ cat logfiles.sql
-- -----------------------------------------------------------------------------------
-- File Name    : /monitoring/logfiles.sql
-- Author       : Maxwell
-- Description  : Displays information about redo log files.
-- Requirements : Access to the V$ views.
-- Call Syntax  : @logfiles
-- Last Modified: 08-AUG-2022
-- -----------------------------------------------------------------------------------

SET LINESIZE 200
COLUMN member FORMAT A50
COLUMN first_change# FORMAT 99999999999999999999
COLUMN next_change# FORMAT 99999999999999999999

SELECT l.thread#,
       lf.group#,
       lf.member,
       TRUNC(l.bytes/1024/1024) AS size_mb,
       l.status,
       l.archived,
       lf.type,
       lf.is_recovery_dest_file AS rdf,
       l.sequence#,
       l.first_change#,
       l.next_change#
FROM   v$logfile lf
       JOIN v$log l ON l.group# = lf.group#
ORDER BY l.thread#,lf.group#, lf.member;

SET LINESIZE 80
[[email protected] monitoring]$ 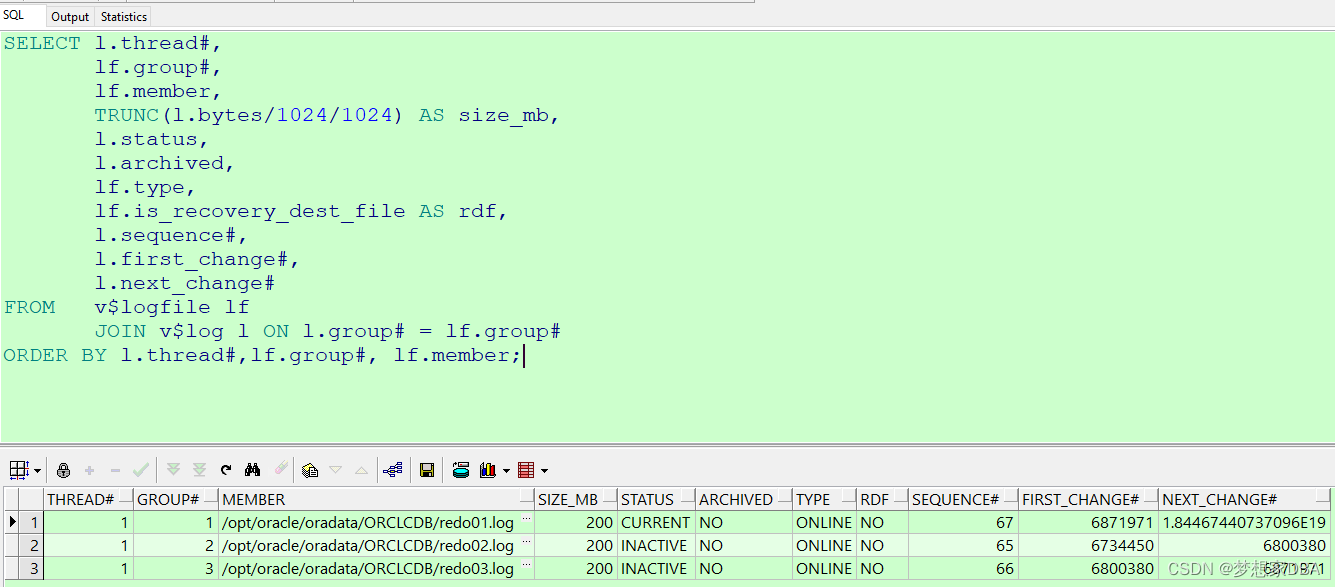
83.Script: longops.sql
-- Description : Displays information on all long operations.
[[email protected] monitoring]$ cat longops.sql
-- -----------------------------------------------------------------------------------
-- File Name    : /monitoring/longops.sql
-- Author       : Maxwell
-- Description  : Displays information on all long operations.
-- Requirements : Access to the V$ views.
-- Call Syntax  : @longops
-- Last Modified: 08-AUG-2022
-- -----------------------------------------------------------------------------------

COLUMN sid FORMAT 999
COLUMN serial# FORMAT 9999999
COLUMN machine FORMAT A30
COLUMN progress_pct FORMAT 99999999.00
COLUMN elapsed FORMAT A10
COLUMN remaining FORMAT A10

SELECT s.sid,
       s.serial#,
       s.machine,
       ROUND(sl.elapsed_seconds/60) || ':' || MOD(sl.elapsed_seconds,60) elapsed,
       ROUND(sl.time_remaining/60) || ':' || MOD(sl.time_remaining,60) remaining,
       ROUND(sl.sofar/sl.totalwork*100, 2) progress_pct
FROM   v$session s,
       v$session_longops sl
WHERE  s.sid     = sl.sid
AND    s.serial# = sl.serial#;
[[email protected] monitoring]$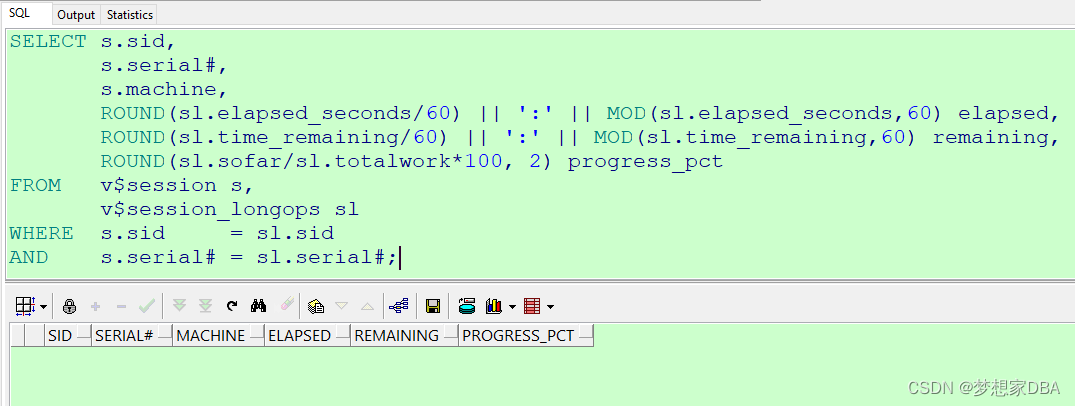
84.Script: lru_latch_ratio.sql
-- Description : Displays current LRU latch ratios.
[[email protected] monitoring]$ cat lru_latch_ratio.sql
-- -----------------------------------------------------------------------------------
-- File Name    : /monitoring/lru_latch_ratio.sql
-- Author       : Maxwell
-- Description  : Displays current LRU latch ratios.
-- Requirements : Access to the V$ views.
-- Call Syntax  : @lru_latch_hit_ratio
-- Last Modified: 08-AUG-2022
-- -----------------------------------------------------------------------------------
SET LINESIZE 500
SET PAGESIZE 1000
COLUMN "Ratio %" FORMAT 990.00

PROMPT
PROMPT Values greater than 3% indicate contention.

SELECT a.child#,
       (a.SLEEPS / a.GETS) * 100 "Ratio %"
FROM   v$latch_children a
WHERE  a.name      = 'cache buffers lru chain'
ORDER BY 1;


SET PAGESIZE 14
[[email protected] monitoring]$
85.Script: max_extents.sql
-- Description : Displays all tables and indexes nearing their MAX_EXTENTS setting.
[[email protected] monitoring]$ cat max_extents.sql
-- -----------------------------------------------------------------------------------
-- File Name    : /monitoring/max_extents.sql
-- Author       : Maxwell
-- Description  : Displays all tables and indexes nearing their MAX_EXTENTS setting.
-- Requirements : Access to the DBA views.
-- Call Syntax  : @max_extents
-- Last Modified: 08-AUG-2022
-- -----------------------------------------------------------------------------------
SET LINESIZE 500
SET PAGESIZE 1000
SET VERIFY OFF

PROMPT
PROMPT Tables and Indexes nearing MAX_EXTENTS
PROMPT **************************************
SELECT e.owner,
       e.segment_type,
       Substr(e.segment_name, 1, 30) segment_name,
       Trunc(s.initial_extent/1024) "INITIAL K",
       Trunc(s.next_extent/1024) "NEXT K",
       s.max_extents,
       Count(*) as extents
FROM   dba_extents e,
       dba_segments s
WHERE  e.owner        = s.owner
AND    e.segment_name = s.segment_name
AND    e.owner        NOT IN ('SYS', 'SYSTEM')
GROUP BY e.owner, e.segment_type, e.segment_name, s.initial_extent, s.next_extent, s.max_extents
HAVING Count(*) > s.max_extents - 10
ORDER BY e.owner, e.segment_type, Count(*) DESC;
[[email protected] monitoring]$ 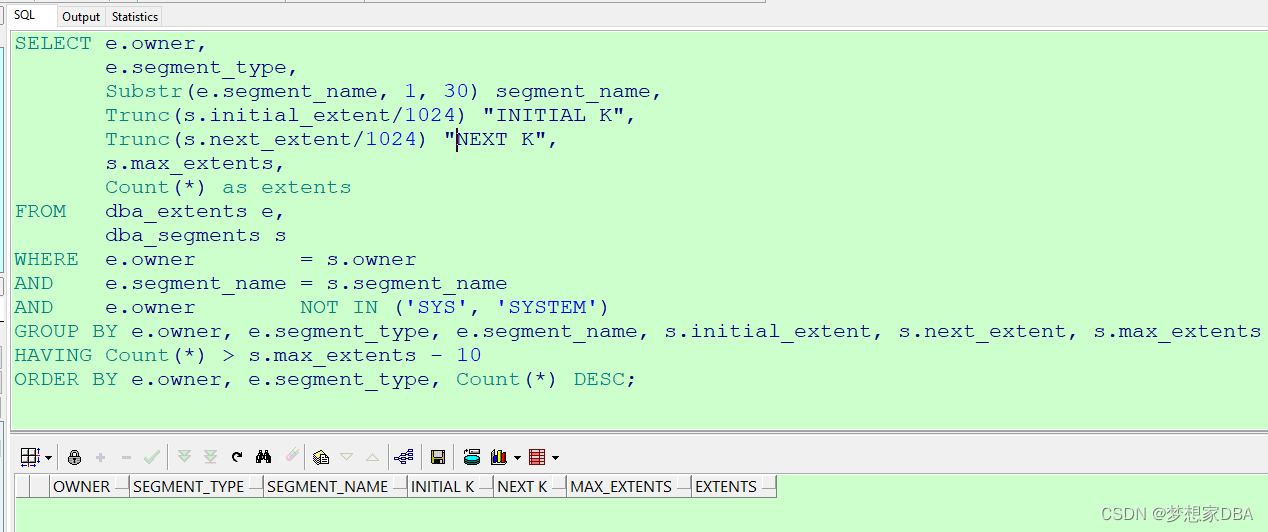
86.Script: min_datafile_size.sql
-- Description : Displays smallest size the datafiles can shrink to without a reorg.
[[email protected] monitoring]$ cat min_datafile_size.sql
-- -----------------------------------------------------------------------------------
-- File Name    : /monitoring/min_datafile_size.sql
-- Author       : Maxwell
-- Description  : Displays smallest size the datafiles can shrink to without a reorg.
-- Requirements : Access to the V$ and DBA views.
-- Call Syntax  : @min_datafile_size
-- Last Modified: 08-AUG-2022
-- -----------------------------------------------------------------------------------

COLUMN block_size NEW_VALUE v_block_size

SELECT TO_NUMBER(value) AS block_size
FROM   v$parameter
WHERE  name = 'db_block_size';

COLUMN tablespace_name FORMAT A20
COLUMN file_name FORMAT A50
COLUMN current_bytes FORMAT 999999999999999
COLUMN shrink_by_bytes FORMAT 999999999999999
COLUMN resize_to_bytes FORMAT 999999999999999
SET VERIFY OFF
SET LINESIZE 200

SELECT a.tablespace_name,
       a.file_name,
       a.bytes AS current_bytes,
       a.bytes - b.resize_to AS shrink_by_bytes,
       b.resize_to AS resize_to_bytes
FROM   dba_data_files a,
       (SELECT file_id, MAX((block_id+blocks-1)*&v_block_size) AS resize_to
                FROM   dba_extents
                        GROUP by file_id) b
                WHERE  a.file_id = b.file_id
                ORDER BY a.tablespace_name, a.file_name;
[[email protected] monitoring]$ 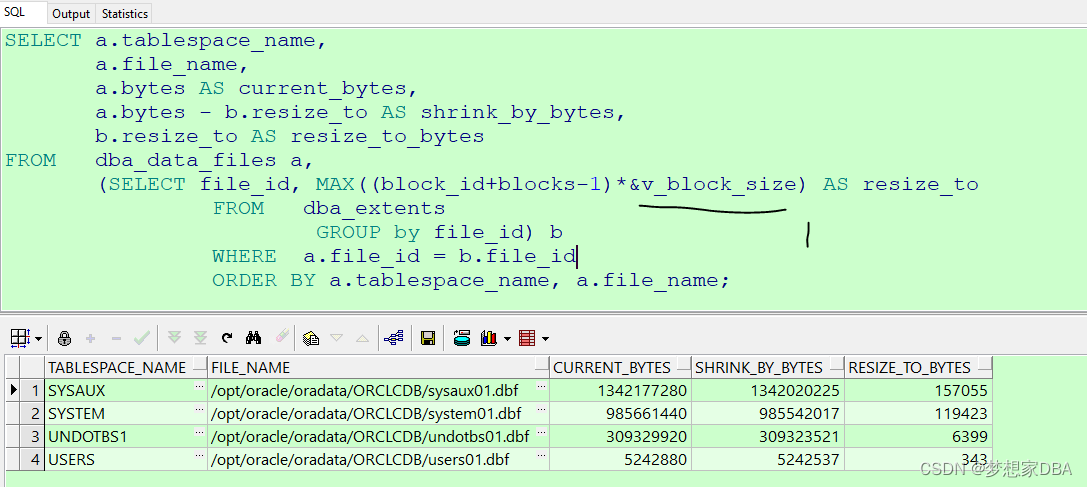
87.Script: part_tables.sql
-- Description : Displays information about all partitioned tables.
[[email protected] monitoring]$ cat part_tables.sql
-- -----------------------------------------------------------------------------------
-- File Name    : /monitoring/part_tables.sql
-- Author       : Maxwell
-- Description  : Displays information about all partitioned tables.
-- Requirements : Access to the DBA views.
-- Call Syntax  : @part_tables
-- Last Modified: 08-AUG-2022
-- -----------------------------------------------------------------------------------

SELECT owner, table_name, partitioning_type, partition_count
FROM   dba_part_tables
WHERE  owner NOT IN ('SYS', 'SYSTEM')
ORDER BY owner, table_name;
[[email protected] monitoring]$ 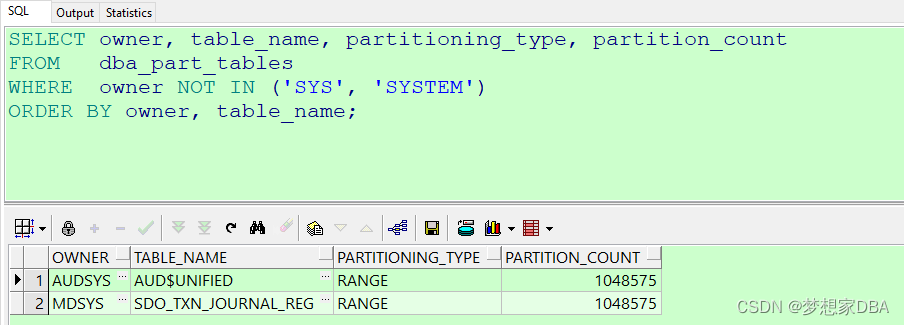
88.Script: page_target_advice.sql
-- Description : Predicts how changes to the PGA_AGGREGATE_TARGET will affect PGA usage.
[[email protected] monitoring]$ cat pga_target_advice.sql
-- -----------------------------------------------------------------------------------
-- File Name    : /monitoring/pga_target_advice.sql
-- Author       : Maxwell
-- Description  : Predicts how changes to the PGA_AGGREGATE_TARGET will affect PGA usage.
-- Requirements : Access to the V$ views.
-- Call Syntax  : @pga_target_advice
-- Last Modified: 08-AUG-2022
-- -----------------------------------------------------------------------------------

SELECT ROUND(pga_target_for_estimate/1024/1024) target_mb,
       estd_pga_cache_hit_percentage cache_hit_perc,
       estd_overalloc_count
FROM   v$pga_target_advice;
[[email protected] monitoring]$ 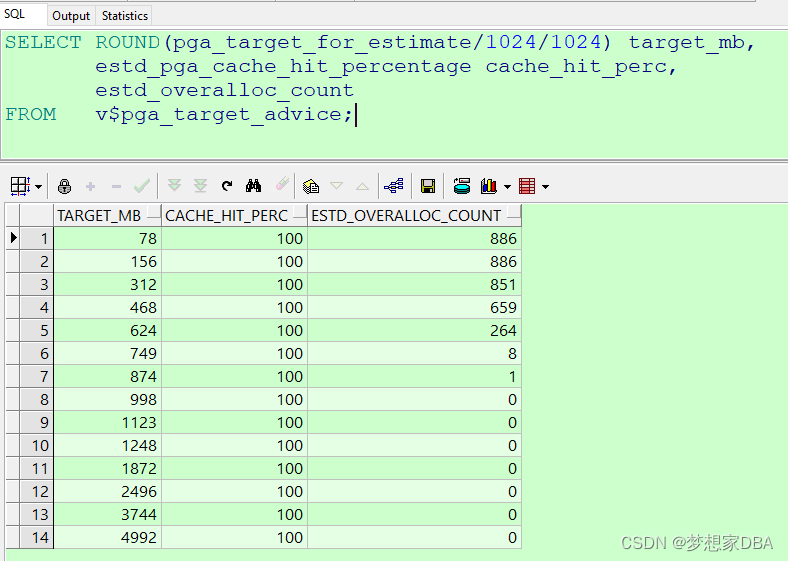
89.Script: pipes.sql
-- Description : Displays a list of all database pipes.
[[email protected] monitoring]$ cat pipes.sql
-- -----------------------------------------------------------------------------------
-- File Name    : /monitoring/pipes.sql
-- Author       : Maxwell
-- Description  : Displays a list of all database pipes.
-- Requirements : Access to the V$ views.
-- Call Syntax  : @pipes
-- Last Modified: 08-AUG-2022
-- -----------------------------------------------------------------------------------
SET LINESIZE 100

COLUMN name FORMAT A40

SELECT ownerid,
       name,
       type,
       pipe_size
FROM   v$db_pipes
ORDER BY 1,2;
[[email protected] monitoring]$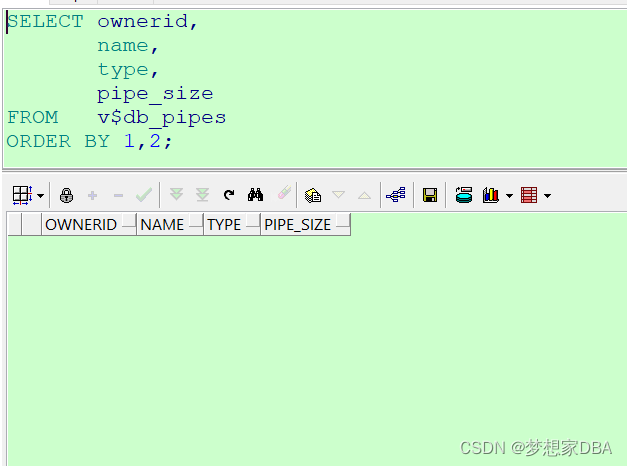
90.Script: profiler_run_details.sql
-- Description : Displays details of a specified profiler run.
[[email protected] monitoring]$ cat profiler_run_details.sql
-- -----------------------------------------------------------------------------------
-- File Name    : /monitoring/profiler_run_details.sql
-- Author       : Maxwell
-- Description  : Displays details of a specified profiler run.
-- Requirements : Access to the V$ views.
-- Call Syntax  : @profiler_run_details.sql (runid)
-- Last Modified: 08-AUG-2022
-- -----------------------------------------------------------------------------------
SET LINESIZE 200
SET VERIFY OFF

COLUMN runid FORMAT 99999
COLUMN unit_number FORMAT 99999
COLUMN unit_type FORMAT A20
COLUMN unit_owner FORMAT A20

SELECT u.runid,
       u.unit_number,
       u.unit_type,
       u.unit_owner,
       u.unit_name,
       d.line#,
       d.total_occur,
       ROUND(d.total_time/d.total_occur) as time_per_occur,
       d.total_time,
       d.min_time,
       d.max_time
FROM   plsql_profiler_units u
       JOIN plsql_profiler_data d ON u.runid = d.runid AND u.unit_number = d.unit_number
WHERE  u.runid = &1
AND    d.total_time > 0
AND    d.total_occur > 0
ORDER BY (d.total_time/d.total_occur) DESC, u.unit_number, d.line#;
[[email protected] monitoring]$ 边栏推荐
- 线程池总结
- 【sqlite3】sqlite3.OperationalError: table addresses has 7 columns but 6 values were supplied
- Silently start over, the first page is also a new page
- 分布式理论
- Rsync常见错误
- ByteDance Interview Questions: Mirror Binary Tree 2020
- Distributed id generator implementation
- 找出数组中不重复的值php
- way of thinking problem-solving skills
- Inception V3 闭眼检测
猜你喜欢
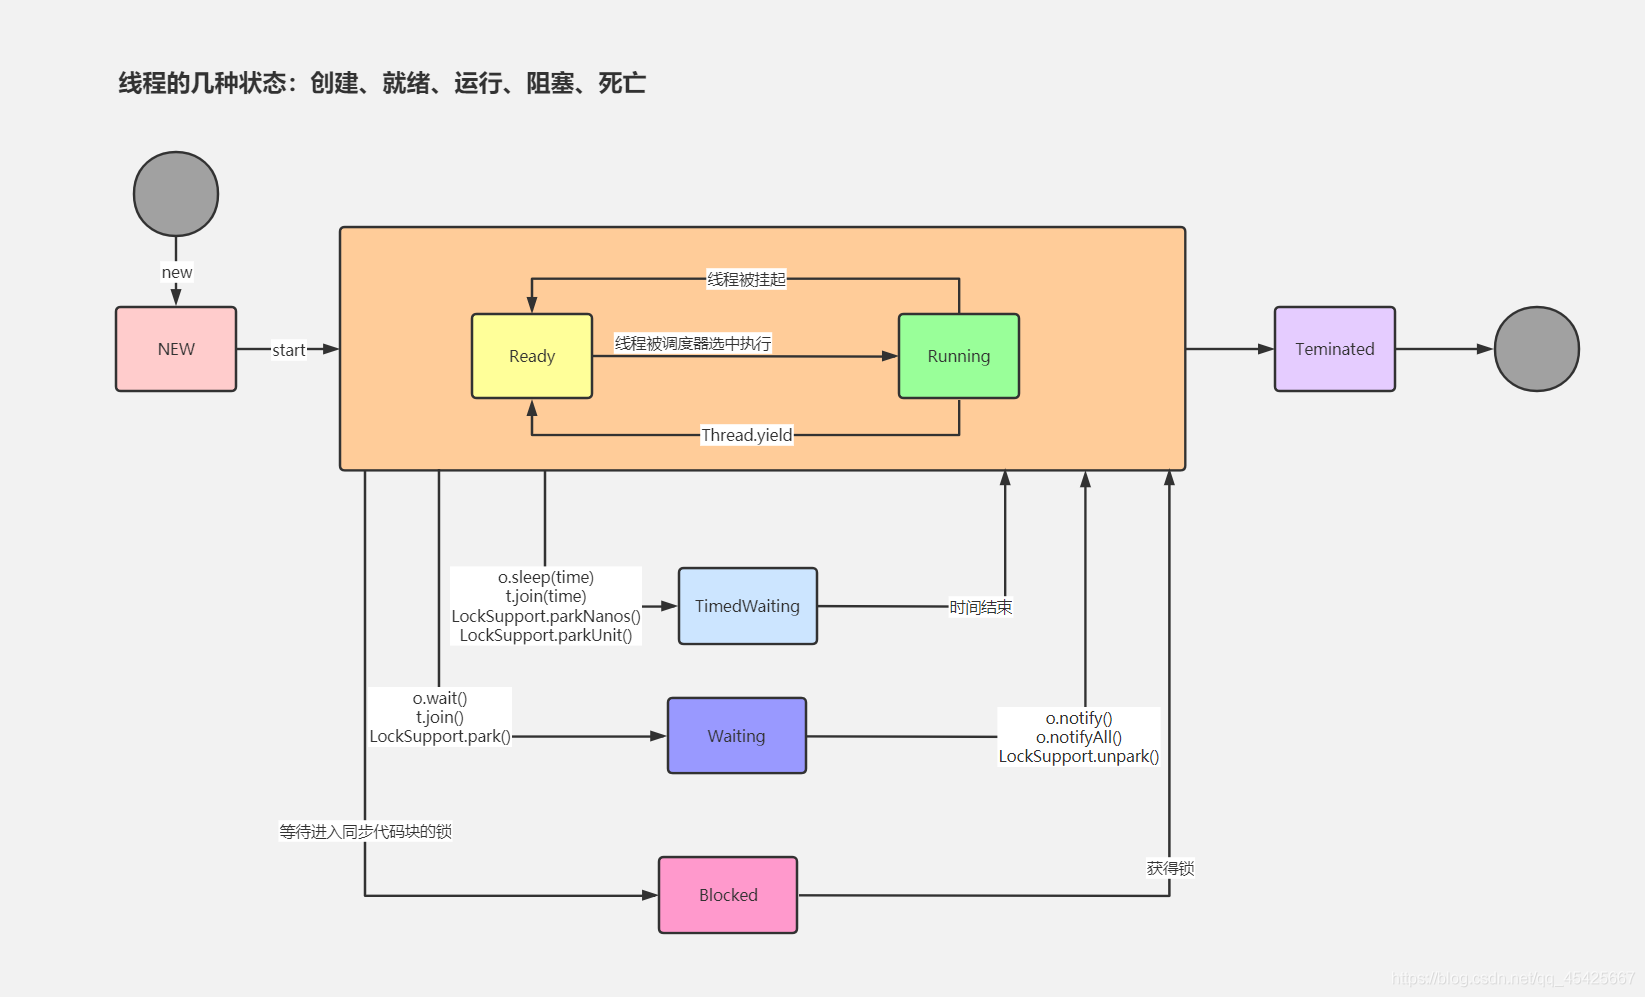
6 states of a thread
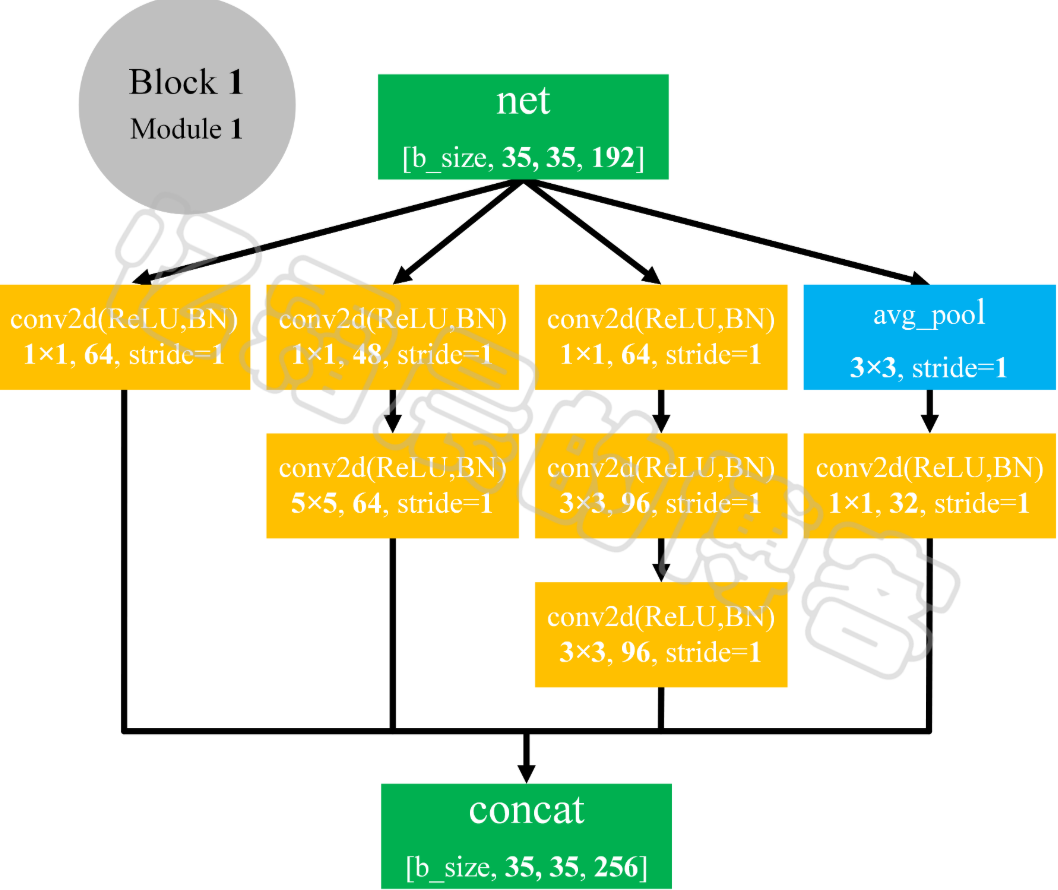
Inception V3 闭眼检测

Distributed id generator implementation

2022 年全球十大最佳自动化测试工具
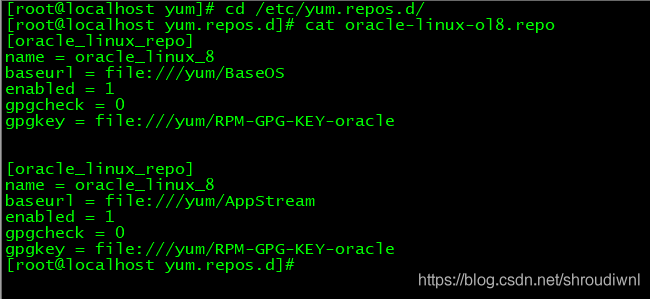
错误:为 repo ‘oracle_linux_repo‘ 下载元数据失败 : Cannot download repomd.xml: Cannot download repodata/repomd.
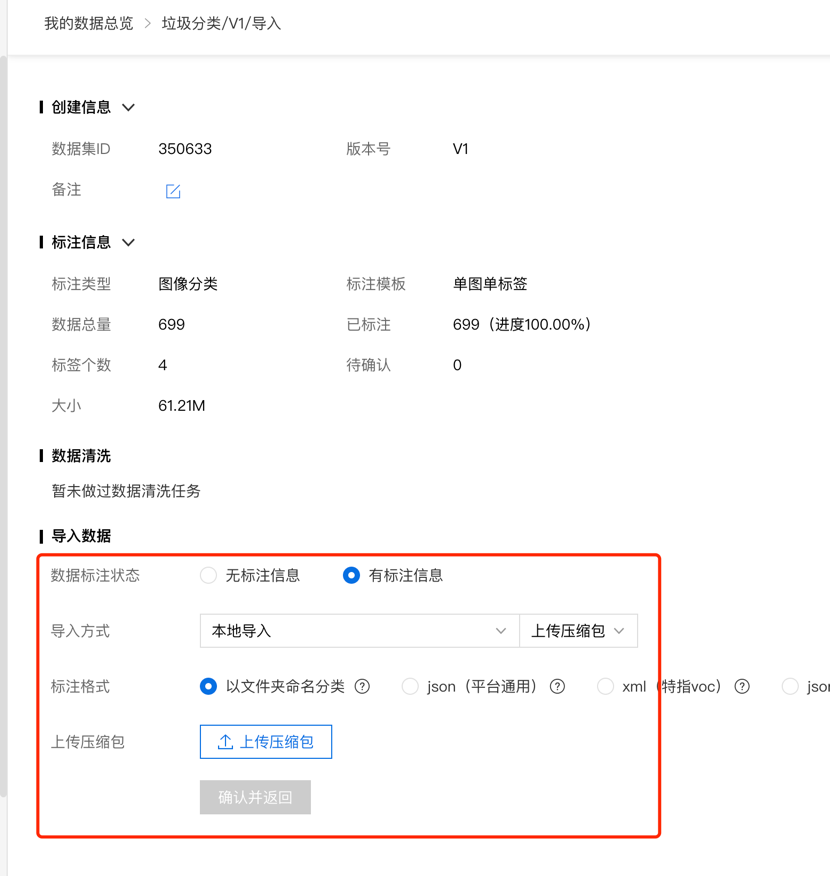
使用百度EasyDL实现智能垃圾箱
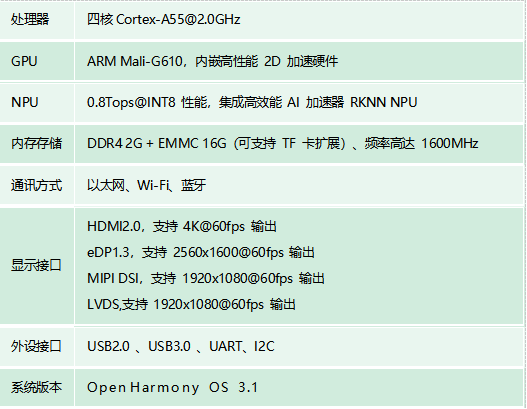
RK3568商显版开源鸿蒙板卡产品解决方案
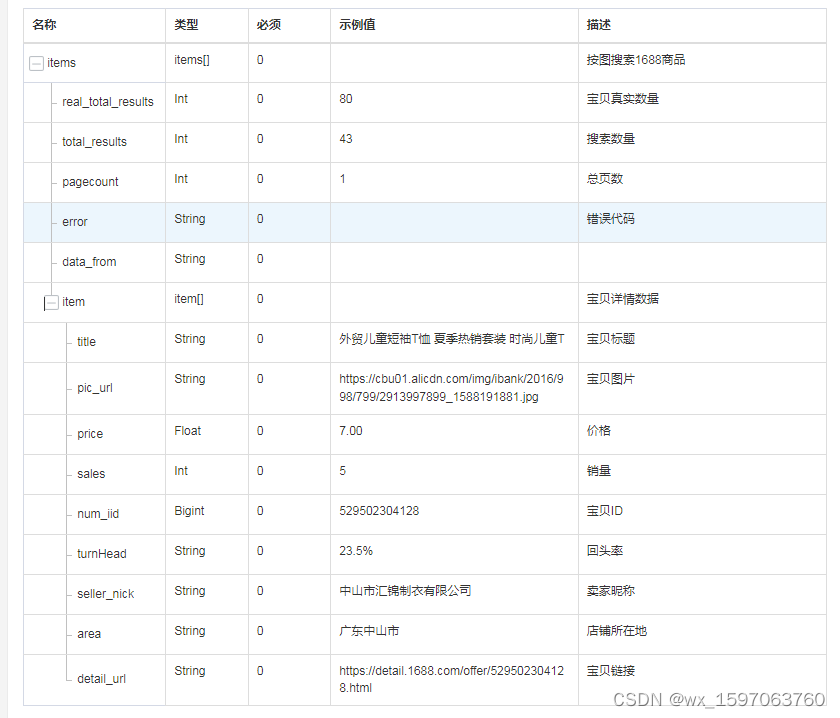
Search 1688 product interface by image (item_search_img-search 1688 product by image (Politao interface) code docking tutorial
分布式id 生成器实现
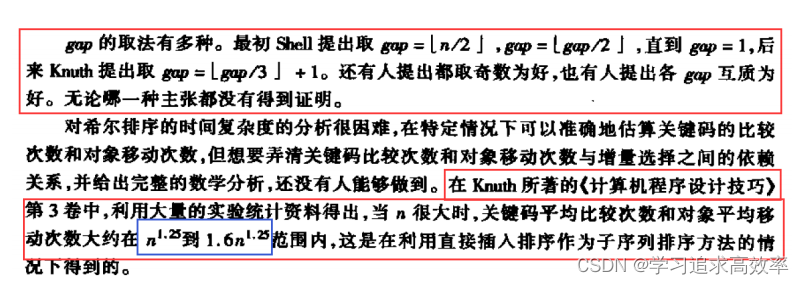
排序第一节——插入排序(直接插入排序+希尔排序)(视频讲解26分钟)
随机推荐
分布式id 生成器实现
P6阿里机试题之2020 斐波那契数
VS2019 common shortcut keys
APP product source data interface (taobao, jingdong/spelling/suning/trill platform details a lot data analysis interface) code and docking tutorial
leetcode 之盛水问题
C语言的内置宏(定义日志宏)
The division principle summary within the collection
日期处理,字符串日期格式转换
排序第三节——交换排序(冒泡排序+快速排序+快排的优化)(5个视频讲解)
虚拟机网卡报错:Bringing up interface eth0: Error: No suitable device found: no device found for connection
事务总结
composer 内存不足够
SIGINT,SIGKILL,SIGTERM信号区别,各类信号总结
入门cv必读的10篇baseline论文
高项 04 项目变更管理
报错:FSADeprecationWarning: SQLALCHEMY_TRACK_MODIFICATIONS重大开销和将disab补充道
mysql summary
分布式事务的应用场景
移远EC20 4G模块拨号相关
Simple to use Lambda expressions