Graphing communities on Twitch.tv in a visually intuitive way

Overview

VisualizingTwitchCommunities

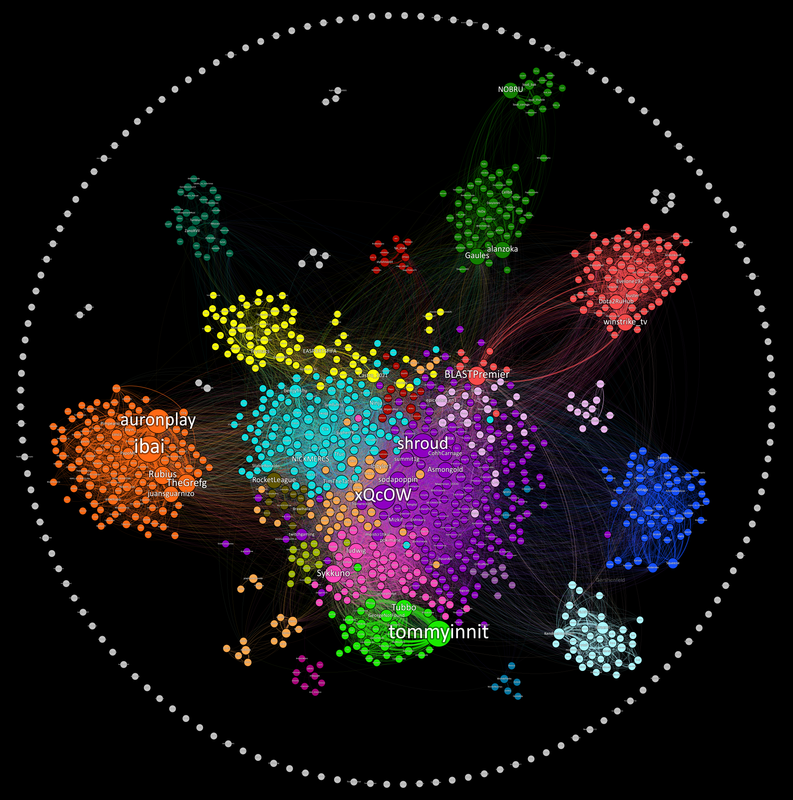
This project maps communities of streamers on Twitch.tv based on shared viewership. The data is collected from the Twitch API and visualized in Gephi.

Results

Twitch-Communities-High-Res.png

I wrote an article on TowardsDataScience here

If your curious about how to read this graph and why I made it, check out the article.

How can I mess with the graph?

I made the graph in a free data visualization tool called Gephi. Download it here The data set is in Visulization/GephiData . In gephi go to laboratory and import the edge file as an edgelist. Then import the label file as a node list. From there you can go to overview and run a modularity analysis on the nodes to detect communities.

How can I collect more data?

The DataCollection folder has a script called main that can be ran to collect the top 100 streams and all their viewers and save it to a csv. You can use the windows task scheduler to run this task at any time interval you like and build up data over long periods of time.
Owner
Kiran Gershenfeld
Making Lives Easier With Computers
Kiran Gershenfeld
The Spectral Diagram (SD) is a new tool for the comparison of time series in the frequency domain

The Spectral Diagram (SD) is a new tool for the comparison of time series in the frequency domain. The SD provides a novel way to display the coherence function, power, amplitude, phase, and skill sc

Mabel 3 Oct 10, 2022
Data aggregated from the reports found at the MCPS COVID Dashboard into a set of visualizations.

Montgomery County Public Schools COVID-19 Visualizer Contents About this project Data Support this project About this project Data All data we use can

James 3 Jan 19, 2022
A comprehensive tutorial for plotting focal mechanism

Focal_Mechanisms_Demo A comprehensive tutorial for plotting focal mechanism "beach-balls" using the PyGMT package for Python. (Resulting map of this d

3 Dec 13, 2022
This is a super simple visualization toolbox (script) for transformer attention visualization ✌

Trans_attention_vis This is a super simple visualization toolbox (script) for transformer attention visualization ✌ 1. How to prepare your attention m

Mingyu Wang 3 Jul 09, 2022
Comparing USD and GBP Exchange Rates

Currency Data Visualization Comparing USD and GBP Exchange Rates This is a bar graph comparing GBP and USD exchange rates. I chose blue for the UK bec

5 Oct 28, 2021
Color maps for POV-Ray v3.7 from the Plasma, Inferno, Magma and Viridis color maps in Python's Matplotlib

POV-Ray-color-maps Color maps for POV-Ray v3.7 from the Plasma, Inferno, Magma and Viridis color maps in Python's Matplotlib. The include file Color_M

Tor Olav Kristensen 1 Apr 05, 2022
Project coded in Python using Pandas to look at changes in chase% for batters facing a pitcher first time through the order vs. thrid time

Project coded in Python using Pandas to look at changes in chase% for batters facing a pitcher first time through the order vs. thrid time

Jason Kraynak 1 Jan 07, 2022
Streamlit-template - A streamlit app template based on streamlit-option-menu

streamlit-template A streamlit app template for geospatial applications based on

Qiusheng Wu 41 Dec 10, 2022
China and India Population and GDP Visualization

China and India Population and GDP Visualization Historical Population Comparison between India and China This graph shows the population data of Indi

Nicolas De Mello 10 Oct 27, 2021
🗾 Streamlit Component for rendering kepler.gl maps

streamlit-keplergl 🗾 Streamlit Component for rendering kepler.gl maps in a streamlit app. 🎈 Live Demo 🎈 Installation pip install streamlit-keplergl

Christoph Rieke 39 Dec 14, 2022
Streamlit dashboard examples - Twitter cashtags, StockTwits, WSB, Charts, SQL Pattern Scanner

streamlit-dashboards Streamlit dashboard examples - Twitter cashtags, StockTwits, WSB, Charts, SQL Pattern Scanner Tutorial Video https://ww

122 Dec 21, 2022
A data visualization curriculum of interactive notebooks.

A data visualization curriculum of interactive notebooks, using Vega-Lite and Altair. This repository contains a series of Python-based Jupyter notebooks.

UW Interactive Data Lab 1.2k Dec 30, 2022
HW_02 Data visualisation task

HW_02 Data visualisation and Matplotlib practice Instructions for HW_02 Idea for data analysis As I was brainstorming ideas and running through databa

9 Dec 13, 2022
Lightspin AWS IAM Vulnerability Scanner

Red-Shadow Lightspin AWS IAM Vulnerability Scanner Description Scan your AWS IAM Configuration for shadow admins in AWS IAM based on misconfigured den

Lightspin 90 Dec 14, 2022
Statistical data visualization using matplotlib

seaborn: statistical data visualization Seaborn is a Python visualization library based on matplotlib. It provides a high-level interface for drawing

Michael Waskom 10.2k Dec 30, 2022
This is a small repository for me to implement my simply Data Visualisation skills through Python.

Data Visualisations This is a small repository for me to implement my simply Data Visualisation skills through Python. Steam Population Chart from 10/

9 Dec 31, 2021
Squidpy is a tool for the analysis and visualization of spatial molecular data.

Squidpy is a tool for the analysis and visualization of spatial molecular data. It builds on top of scanpy and anndata, from which it inherits modularity and scalability. It provides analysis tools t

Theis Lab 251 Dec 19, 2022
This component provides a wrapper to display SHAP plots in Streamlit.

streamlit-shap This component provides a wrapper to display SHAP plots in Streamlit.

Snehan Kekre 30 Dec 10, 2022
Tools for calculating and visualizing Elo-like ratings of MLB teams using Retosheet data

Overview This project uses historical baseball games data to calculate an Elo-like rating for MLB teams based on regular season match ups. The Elo rat

Lukas Owens 0 Aug 25, 2021
Calendar heatmaps from Pandas time series data

Note: See MarvinT/calmap for the maintained version of the project. That is also the version that gets published to PyPI and it has received several f

Martijn Vermaat 195 Dec 22, 2022