Sentiment Analysis application created with Python and Dash, hosted at socialsentiment.net

Overview

Social Sentiment Dash Application

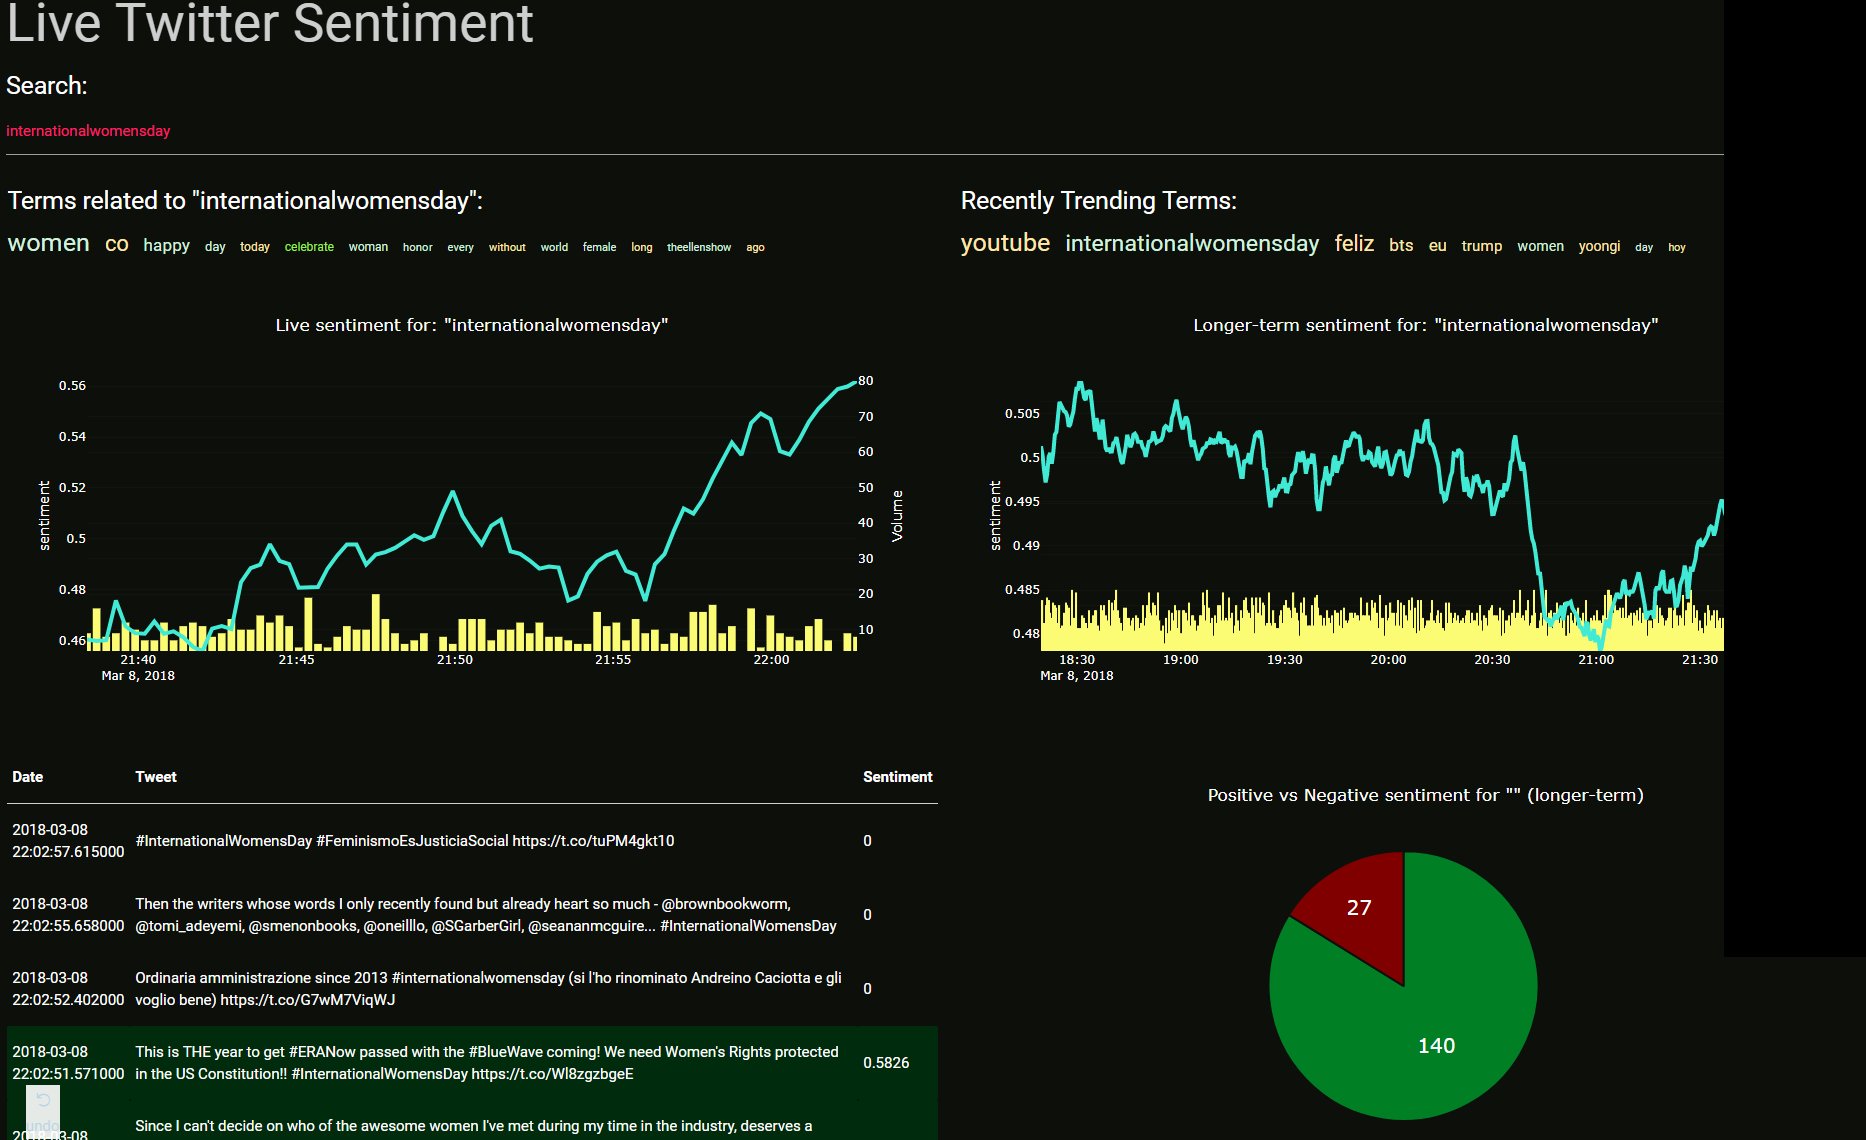
Live-streaming sentiment analysis application created with Python and Dash, hosted at SocialSentiment.net.

application example

Dash Tutorials

This application was created in conjunction with the Dash tutorial series.

Repo Contents:

  • dash_mess.py - This is currently the main front-end application code. Contains the dash application layouts, logic for graphs, interfaces with the database...etc. Name is descriptive of the overall state of code :) ...this code is setup to run on a flask instance. If you want to clone this and run it locally, you will be using the dev_server.py
  • dev_server.py - If you wish to run this application locally, on the dev server, run via this instead.
  • twitter_stream.py - This should run in the background of your application. This is what streams tweets from Twitter, storing them into the sqlite database, which is what the dash_mess.py file interfaces with.
  • config.py - Meant for many configurations, but right now it just contains stop words. Words we don't intend to ever count in the "trending"
  • cache.py - For caching purposes in effort to get things to run faster.
  • db-truncate.py - A script to truncate the infinitely-growing sqlite database. You will get about 3.5 millionish tweets per day, depending on how fast you can process. You can keep these, but, as the database grows, search times will dramatically suffer.

Quick start

  • Clone repo
  • install requirements.txt using pip install -r requirements.txt
  • Fill in your Twitter App credentials to twitter_stream.py. Go to apps.twitter.com to set that up if you need to.
  • Run twitter_stream.py to build database
  • If you're using this locally, you can run the application with the dev_server.py script. If you want to deploy this to a webserver, see my deploying Dash application tutorial
  • You might need the latest version of sqlite.
sudo add-apt-repository ppa:jonathonf/backports
sudo apt-get update && sudo apt-get install sqlite3
  • Consider running the db-truncate.py from time to time (or via a cronjob), to keep the database reasonably sized. In its current state, the database really doesn't need to store more than 2-3 days of data most likely.

Tips for Running on Server

  • You can use Gunicorn to run the server
gunicorn dash_mess:server -b 0.0.0.0:80 -w 4

Todo

Want to help contribute???

  • Code is ugly. Low hanging fruit is just making the code not so ugly. Up to this point, I've just been in "make it work" mode.
  • App is ugly. I am not a designer. This app is prettttttyyyyyy gross. Think you have a better design? Halp.
  • Click-able related terms and trending terms would be nice. I tried, but failed at this. It'd be cool to see a related term, and be able to just click on it, and this becomes the new searched term, for example.
  • The interactive search is cool, but also does a search in the database per-character. It would be nice if it didn't search per key-press. Not sure I want a search button, I like the streamlined interactivity, but maybe wait 0.2 seconds or something without any new keypresses to perform the search? Something like that might help with speeds. I really do not know the best option here, I just know this isn't idea.
  • Other manipulations or ideas for interactivity? Feel free to show them in a PR.

Credits

The speed of the application, especially with a database with 10's of millions of records is thanks entirely to Daniel Kukiela who helped us to convert from regular sqlite to using fts, helping with the queries, new database structure, caching, and more.
Owner
Harrison
Harrison
Extract data from ThousandEyes REST API and visualize it on your customized Grafana Dashboard.

ThousandEyes Grafana Dashboard Extract data from the ThousandEyes REST API and visualize it on your customized Grafana Dashboard. Deploy Grafana, Infl

Flo Pachinger 16 Nov 26, 2022
Cartopy - a cartographic python library with matplotlib support

Cartopy is a Python package designed to make drawing maps for data analysis and visualisation easy. Table of contents Overview Get in touch License an

1.2k Jan 01, 2023
a robust room presence solution for home automation with nearly no false negatives

Argos Room Presence This project builds a room presence solution on top of Argos. Using just a cheap raspberry pi zero w (plus an attached pi camera,

Angad Singh 46 Sep 18, 2022
Sprint planner considering JIRA issues and google calendar meetings schedule.

Sprint planner Sprint planner is a Python script for planning your Jira tasks based on your calendar availability. Installation Use the package manage

Apptension 2 Dec 05, 2021
Drug design and development team HackBio internship is a virtual bioinformatics program that introduces students and professional to advanced practical bioinformatics and its applications globally.

-Nyokong. Drug design and development team HackBio internship is a virtual bioinformatics program that introduces students and professional to advance

4 Aug 04, 2022
A Python library created to assist programmers with complex mathematical functions

libmaths was created not only as a learning experience for me, but as a way to make mathematical models in seconds for Python users using mat

Simple 73 Oct 02, 2022
Some useful extensions for Matplotlib.

mplx Some useful extensions for Matplotlib. Contour plots for functions with discontinuities plt.contour mplx.contour(max_jump=1.0) Matplotlib has pro

Nico Schlömer 519 Dec 30, 2022
Interactive chemical viewer for 2D structures of small molecules

👀 mols2grid mols2grid is an interactive chemical viewer for 2D structures of small molecules, based on RDKit. ➡️ Try the demo notebook on Google Cola

Cédric Bouysset 154 Dec 26, 2022
Getting started with Python, Dash and Plot.ly for the Data Dashboards team

data_dashboards Getting started with Python, Dash and Plot.ly for the Data Dashboards team Getting started MacOS users: # Install the pyenv version ma

Department for Levelling Up, Housing and Communities 1 Nov 08, 2021
Shaded 😎 quantile plots

shadyquant 😎 This python package allows you to quantile and plot lines where you have multiple samples, typically for visualizing uncertainty. Your d

Mehrad Ansari 13 Sep 29, 2022
Analysis and plotting for motor/prop/ESC characterization, thrust vs RPM and torque vs thrust

esc_test This is a Python package used to plot and analyze data collected for the purpose of characterizing a particular propeller, motor, and ESC con

Alex Spitzer 1 Dec 28, 2021
A python script and steps to display locations of peers connected to qbittorrent

A python script (along with instructions) to display the locations of all the peers your qBittorrent client is connected to in a Grafana worldmap dash

62 Dec 07, 2022
Simple python implementation with matplotlib to manually fit MIST isochrones to Gaia DR2 color-magnitude diagrams

Simple python implementation with matplotlib to manually fit MIST isochrones to Gaia DR2 color-magnitude diagrams

Karl Jaehnig 7 Oct 22, 2022
Main repository for Vispy

VisPy: interactive scientific visualization in Python Main website: http://vispy.org VisPy is a high-performance interactive 2D/3D data visualization

vispy 3k Jan 03, 2023
A high-level plotting API for pandas, dask, xarray, and networkx built on HoloViews

hvPlot A high-level plotting API for the PyData ecosystem built on HoloViews. Build Status Coverage Latest dev release Latest release Docs What is it?

HoloViz 697 Jan 06, 2023
a plottling library for python, based on D3

Hello August 2013 Hello! Maybe you're looking for a nice Python interface to build interactive, javascript based plots that look as nice as all those

Mike Dewar 1.4k Dec 28, 2022
Visualize the training curve from the *.csv file (tensorboard format).

Training-Curve-Vis Visualize the training curve from the *.csv file (tensorboard format). Feature Custom labels Curve smoothing Support for multiple c

Luckky 7 Feb 23, 2022
Gallery of applications built using bqplot and widget libraries like ipywidgets, ipydatagrid etc.

bqplot Gallery This is a gallery of bqplot examples. View the gallery at https://bqplot.github.io/bqplot-gallery. Contributing new examples Clone this

8 Aug 23, 2022
Using SQLite within Python to create database and analyze Starcraft 2 units data (Pandas also used)

SQLite python Starcraft 2 English This project shows the usage of SQLite with python. To create, modify and communicate with the SQLite database from

1 Dec 30, 2021
Visualize and compare datasets, target values and associations, with one line of code.

In-depth EDA (target analysis, comparison, feature analysis, correlation) in two lines of code! Sweetviz is an open-source Python library that generat

Francois Bertrand 2.3k Jan 05, 2023