阴阳师后台全平台(使用网易 MuMu 模拟器)辅助。支持御魂,觉醒,御灵,结界突破,秘闻副本,地域鬼王。

Overview

阴阳师后台全平台辅助

screen

  • Python 版本:Python 3.8.3
  • 模拟器:网易 MuMu雷电模拟器
  • 模拟器分辨率:1024*576
  • 显卡渲染模式:兼容(OpenGL)
  • 兼容 Windows 系统和 MacOS 系统

思路:

利用 adb 截图后,使用 opencv 找图找色,模拟点击。使用 adb 操作模拟器,相当于后台操作。

我主要为了刷勾玉,所以此工具更侧重地域鬼王,结界突破和秘闻副本,御魂是用来刷突破券的。

为了防止收到鬼使黑的来信,所以增加随机等待的时间比较多,每次随机等待 2-3 秒,导致整体运行速度稍微慢了一些。

此工具适合放在后台干其他工作的同学使用。也比较符合我个人的使用。


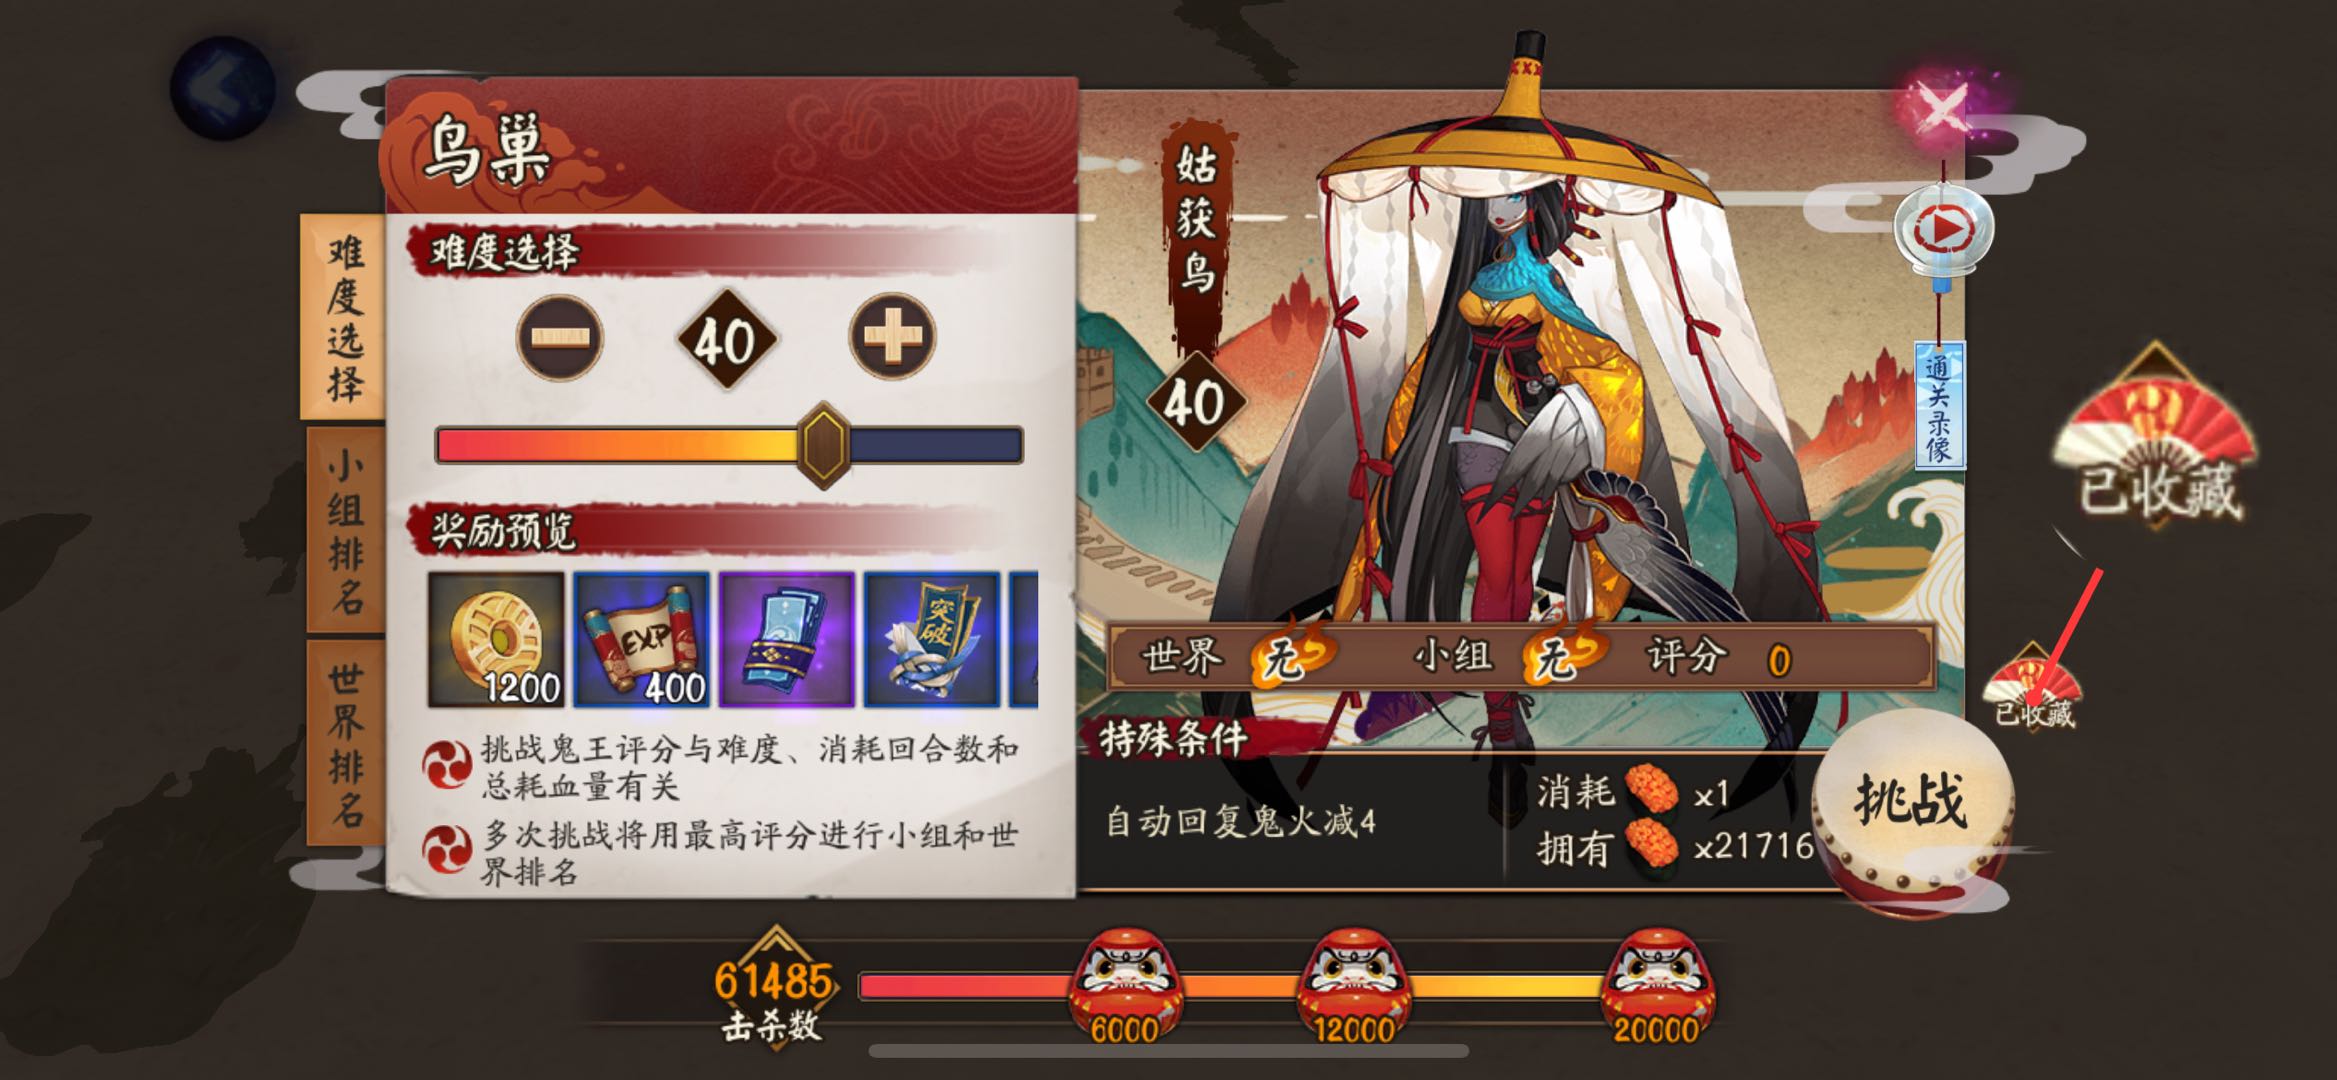
地域鬼王需要先把姑获鸟,以津真天和山童收藏。

收藏

结界突破主要是把九宫格的坐标保存到列表,使用 shuffle 方法随机打乱,然后循环执行。

第一次进入突破会主动失败一次,失败的话难度不会增加,方便刷排名和勾玉使用。

每突破三次会领取一次奖励,等待九次全部完成后,会把右上角突破剩余数量截图上传到腾讯 OCR 识别接口,如果剩余次数大于等于九次,递归执行,否则停止执行。

腾讯 OCR 每月有一千次免费次数。如果只是识别结界券使用,应该是够用了,如果不够用可以按需付费或者自建字典识别。

突破剩余数量

这一步需要申请 腾讯云文字识别 OCR 的 secretId 和 secretKey。

然后新建文件 tencentcloudKeys.py,写入:

secretId = "AKI***********************aYHDtmaOw"
secretKey = "Sg**************************QdZ7X"

模拟器版

部分操作参考 网易 MuMu 开发者必备说明书【雷神命令】常用adb命令整理贴

建议直接看雷神模拟器社区的命令整理,比较详细。

运行阴阳师

如果不清楚应用的启动命令,可以先手动运行该程序,然后使用命令:

adb shell dumpsys window | findstr mCurrentFocus

查找正在运行的应用。

启动阴阳师的命令为:

adb shell am start -n com.netease.onmyoji.netease_simulator/com.netease.onmyoji.Client

因为我是 iOS,只能扫码登录,所以启动命令对我来说并不实用。

模拟点击

例如我们需要点击 500, 266 这个坐标:

adb shell input tap 500 266

模拟滑动

0, 0 滑动到 200, 200,耗时 0.5 秒:

adb shell input swipe 0 0 200 200 500

截图

需要先运行此命令:

adb shell screencap /data/screen.png

再将截图推送到电脑:

adb pull /data/screen.png .

注意:示例中的命令将图片保存到当前路径下。

找图

这里借助 opencv 库实现。

import cv2

def p():
    capture_img = ""  # 程序运行时的截图
    temp_img = ""  # 已经保存好的图片
    
    img1 = cv2.imread(capture_img)
    img2 = cv2.imread(temp_img)
    result = cv2.matchTemplate(img1, img2, cv2.TM_CCOEFF_NORMED)
    
    if result.max() > 0.9:
        return True

找色

如何在截图中获取某坐标的像素值?

import cv2

def p(x, y):
    capture_img = ""
    _img = cv2.imread(capture_img)
    img = cv2.cvtColor(_img, cv2.COLOR_BGR2RGB)
    r, g, b = img[y, x]  # 注意这里的坐标是相反的
    return r, g, b

裁剪图片

我们截图完成以后,如何从截图中获取剩余结界突破数量?

import cv2

capture_img = ""
img = cv2.imread(capture_img)
cv2.imwrite("new.png", img[12:30, 705:750])  # 裁剪坐标为 [y0:y1, x0:x1]

需要注意的是坐标都是 y, x。

双开应用切换

由于多开改版后(2.2.2x86/x64 版本之后)所有的多开应用和原应用都是同一个包名,所以需要通过 UserId 来控制多开的应用。

这里以网易云游戏为例,多开后分别获取包名,使用命令:

adb shell dumpsys window | findstr mCurrentFocus

全部都是 com.netease.android.cloudgame/com.netease.android.cloudgame.MainActivity

所以需要通过切换 UserId 来切换应用。

通过包名来获取对应 UserId:

adb shell ps|findstr com.netease.android.cloudgame

返回如下内容:

对应用户ID

可以看到原端应用的进程 id 是 u0_a36 ,看 _ 前面的 u0 就行,即 UserId=0; 在 MuMu 上一般原端的 UserId=0,多开端 #N1 的 UserId=10,如此类推 #N2 的 UserId=11,#N3 的 UserId=12,#N4 的 UserId=13

所以多开操作分为两步:

  1. 切换 UserId
  2. 打开应用

根据上边的截图,UserId 分别是 0 和 10,如果要在两个应用之间切换可以使用:

# 切换原应用
adb shell am start-user 0
adb shell am start --user 0 com.netease.android.cloudgame/com.netease.android.cloudgame.MainActivity

# 切换多开应用
adb shell am start-user 10
adb shell am start --user 10 com.netease.android.cloudgame/com.netease.android.cloudgame.MainActivity

切换之后就可以继续操作了。

赞赏

Owner
简讯
简讯
HiPlot makes understanding high dimensional data easy

HiPlot - High dimensional Interactive Plotting HiPlot is a lightweight interactive visualization tool to help AI researchers discover correlations and

Facebook Research 2.4k Jan 04, 2023
Movie recommendation using RASA, TigerGraph

Demo run: The below video will highlight the runtime of this setup and some sample real-time conversations using the power of RASA + TigerGraph, Steps

Sudha Vijayakumar 3 Sep 10, 2022
Write python locally, execute SQL in your data warehouse

RasgoQL Write python locally, execute SQL in your data warehouse ≪ Read the Docs · Join Our Slack » RasgoQL is a Python package that enables you to ea

Rasgo 265 Nov 21, 2022
basemap - Plot on map projections (with coastlines and political boundaries) using matplotlib.

Basemap Plot on map projections (with coastlines and political boundaries) using matplotlib. ⚠️ Warning: this package is being deprecated in favour of

Matplotlib Developers 706 Dec 28, 2022
Histogramming for analysis powered by boost-histogram

Hist Hist is an analyst-friendly front-end for boost-histogram, designed for Python 3.7+ (3.6 users get version 2.4). See what's new. Installation You

Scikit-HEP Project 97 Dec 25, 2022
An XLSX spreadsheet renderer for Django REST Framework.

drf-renderer-xlsx provides an XLSX renderer for Django REST Framework. It uses OpenPyXL to create the spreadsheet and returns the data.

The Wharton School 166 Dec 01, 2022
A python-generated website for visualizing the novel coronavirus (COVID-19) data for Greece.

COVID-19-Greece A python-generated website for visualizing the novel coronavirus (COVID-19) data for Greece. Data sources Data provided by Johns Hopki

Isabelle Viktoria Maciohsek 23 Jan 03, 2023
A Python library created to assist programmers with complex mathematical functions

libmaths was created not only as a learning experience for me, but as a way to make mathematical models in seconds for Python users using mat

Simple 73 Oct 02, 2022
This is Pygrr PolyArt, a program used for drawing custom Polygon models for your Pygrr project!

This is Pygrr PolyArt, a program used for drawing custom Polygon models for your Pygrr project!

Isaac 4 Dec 14, 2021
Create HTML profiling reports from pandas DataFrame objects

Pandas Profiling Documentation | Slack | Stack Overflow Generates profile reports from a pandas DataFrame. The pandas df.describe() function is great

10k Jan 01, 2023
Geocoding library for Python.

geopy geopy is a Python client for several popular geocoding web services. geopy makes it easy for Python developers to locate the coordinates of addr

geopy 3.8k Jan 02, 2023
Visualize tensors in a plain Python REPL using Sparklines

Visualize tensors in a plain Python REPL using Sparklines

Shawn Presser 43 Sep 03, 2022
View part of your screen in grayscale or simulated color vision deficiency.

monolens View part of your screen in grayscale or filtered to simulate color vision deficiency. Watch the demo on YouTube. Install with pip install mo

Hans Dembinski 31 Oct 11, 2022
Fast visualization of radar_scenes based on oleschum/radar_scenes

RadarScenes Tools About This python package provides fast visualization for the RadarScenes dataset. The Open GL based visualizer is smoother than ole

Henrik Söderlund 2 Dec 09, 2021
Movies-chart - A CLI app gets the top 250 movies of all time from imdb.com and the top 100 movies from rottentomatoes.com

movies-chart This CLI app gets the top 250 movies of all time from imdb.com and

3 Feb 17, 2022
3D-Lorenz-Attractor-simulation-with-python

3D-Lorenz-Attractor-simulation-with-python Animação 3D da trajetória do Atrator de Lorenz, implementada em Python usando o método de Runge-Kutta de 4ª

Hevenicio Silva 17 Dec 08, 2022
A central task in drug discovery is searching, screening, and organizing large chemical databases

A central task in drug discovery is searching, screening, and organizing large chemical databases. Here, we implement clustering on molecular similarity. We support multiple methods to provide a inte

NVIDIA Corporation 124 Jan 07, 2023
Graphical visualizer for spectralyze by Lauchmelder23

spectralyze visualizer Graphical visualizer for spectralyze by Lauchmelder23 Install Install matplotlib and ffmpeg. Put ffmpeg.exe in same folder as v

Matthew 1 Dec 21, 2021
eoplatform is a Python package that aims to simplify Remote Sensing Earth Observation by providing actionable information on a wide swath of RS platforms and provide a simple API for downloading and visualizing RS imagery

An Earth Observation Platform Earth Observation made easy. Report Bug | Request Feature About eoplatform is a Python package that aims to simplify Rem

Matthew Tralka 4 Aug 11, 2022
Boltzmann visualization - Visualize the Boltzmann distribution for simple quantum models of molecular motion

Boltzmann visualization - Visualize the Boltzmann distribution for simple quantum models of molecular motion

1 Jan 22, 2022