leafmap - A Python package for geospatial analysis and interactive mapping in a Jupyter environment.

Overview

Welcome to leafmap

image image image image image image image image image image

A Python package for geospatial analysis and interactive mapping in a Jupyter environment.

Introduction

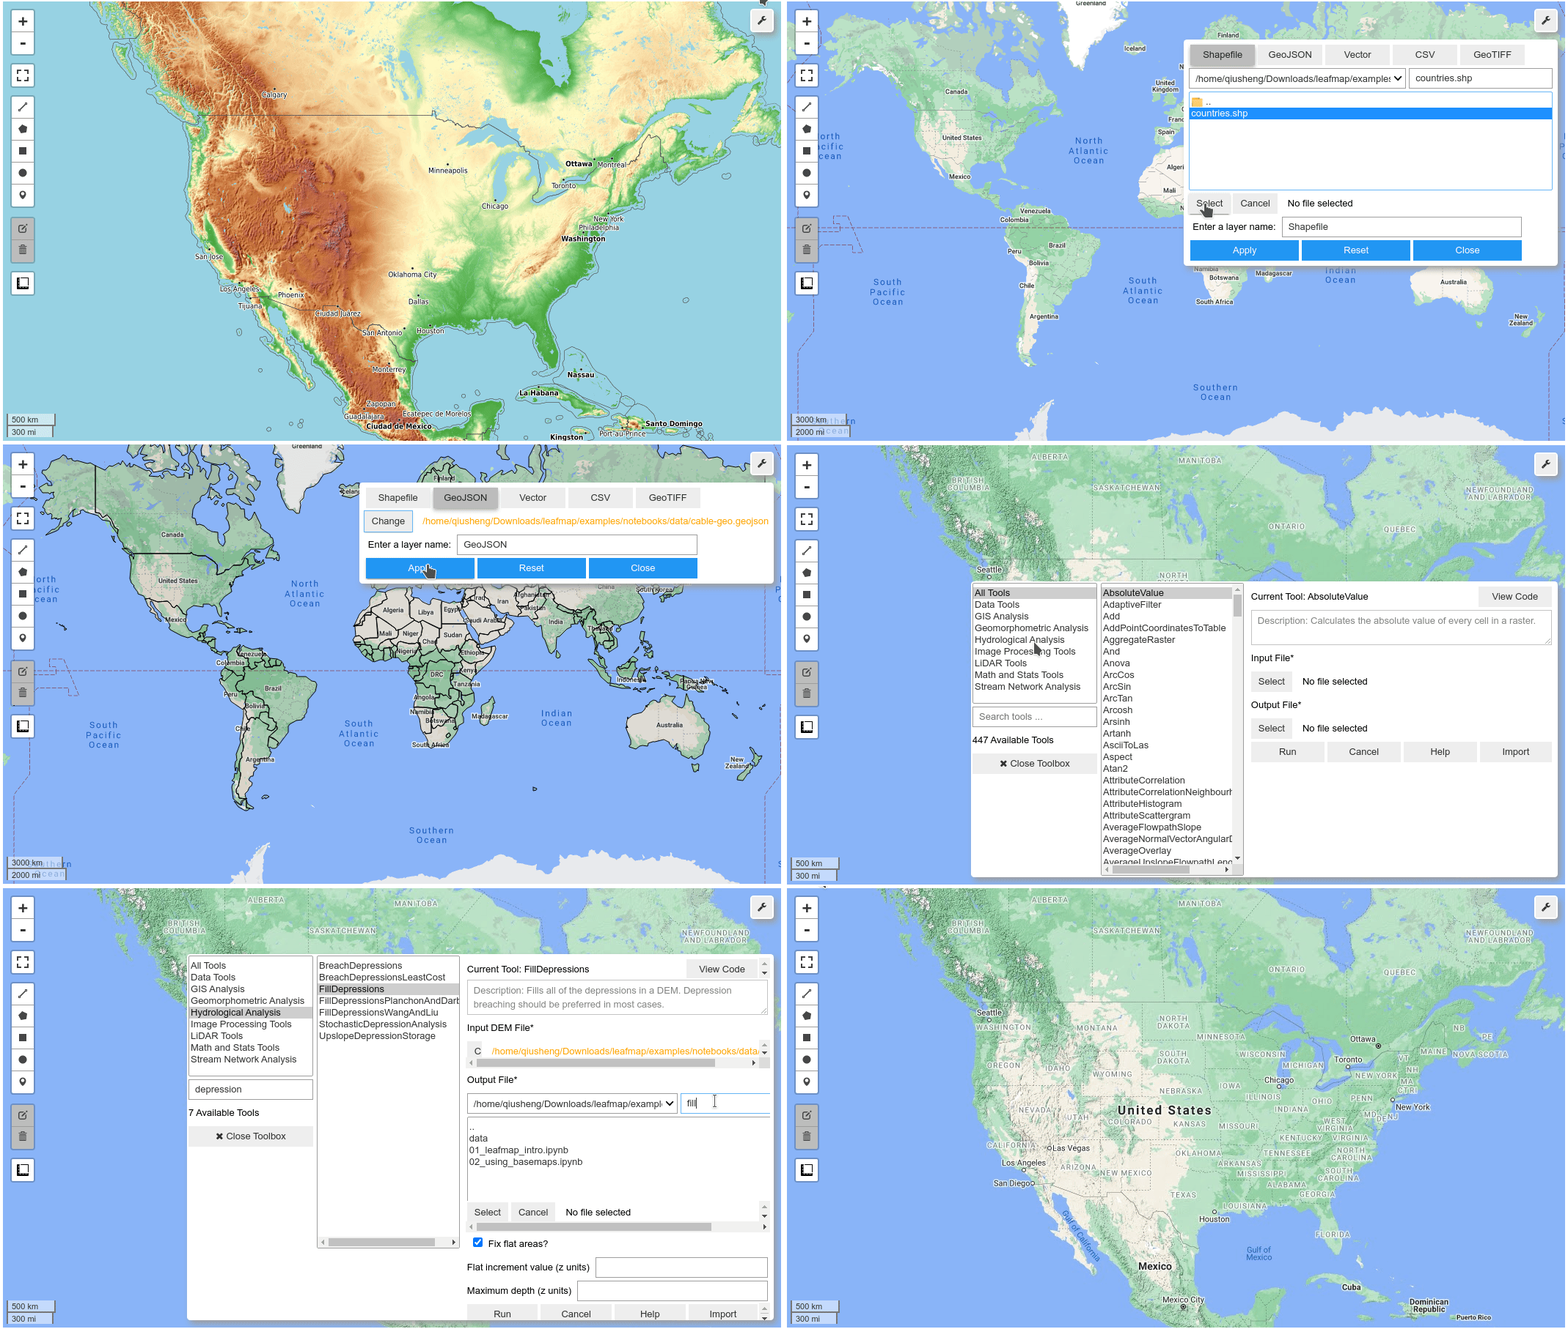
leafmap is a Python package for geospatial analysis and interactive mapping in a Jupyter environment. It is a spin-off project of the geemap Python package, which was designed specifically to work with Google Earth Engine (GEE). However, not everyone in the geospatial community has a GEE account. leafmap is designed to fill this gap for non-GEE users. It enables users to perform advanced geospatial analysis and interactive mapping with minimal coding in a Jupyter environment (e.g., Google Colab, JupyterLab, Jupyter notebook). It is built upon a number of open-source packages, such as folium and ipyleaflet (for creating interactive maps), WhiteboxTools and whiteboxgui (for analyzing geospatial data), and ipywidgets (for designing interactive graphical user interface).

The WhiteboxTools library currently contains 447 tools, which are each grouped based on their main function into one of the following categories. For a list of available tools with comprehensive documentation and usage details, please see the WhiteboxTools User Manual.

Launch the interactive notebook tutorial for the leafmap Python package with Google Colab or Binder now:

image image

Key Features

Below is a partial list of features available for the leafmap package. Please check the examples page for notebook examples, GIF animations, and video tutorials.

  • Create an interactive map with only one-line of code.
  • Select from a variety of basemaps interactively without coding.
  • Add XYZ and WMS tile services to the map.
  • Convert CSV to points and display points as a marker cluster.
  • Add local vector data (e.g., shapefile, GeoJSON, KML) to the map without coding.
  • Add local raster data (e.g., GeoTIFF) to the map without coding.
  • Add Cloud Optimized GeoTIFF (COG) and SpatialTemporal Asset Catalog (STAC) to the map.
  • Add custom legends and colorbars to the map.
  • Perform geospatial analysis using WhiteboxTools and whiteboxgui.
  • Publish interactive maps with only one line of code.

Demo

YouTube Channel

I have created a YouTube Channel for sharing geospatial tutorials. You can subscribe to my channel for regular updates. If there is any specific tutorial you would like to see, please submit a feature request here.

Earth Engine Tutorials on YouTube

Comments
  • Install on Pyodide/JupyterLite

    Install on Pyodide/JupyterLite

    It would be really cool to run leafmap on Pyodide and hence JupyterLite using micropip.

    I gave it a try and found basically two issues with non-existing Python 3 source wheels (needed by micropip) for pycrs and pyshp on PyPI for which I've created these tickets (but there might be wheels for them hosted somewhere else): https://github.com/karimbahgat/PyCRS/issues/56 and https://github.com/GeospatialPython/pyshp/issues/217. And here-map-widget-for-jupyter can be installed, too, but still has some issue with the JupyterLab extension, as described on https://github.com/heremaps/here-map-widget-for-jupyter/issues/25. Folium can be installed in a somewhat complicated manner, see the notebook pyolite folium.ipynb on JupyterLite.

    Not sure if anything else is needed... ;)

    help wanted Feature Request 
    opened by deeplook 20
  • QGIS Layer export TIF on leafmap

    QGIS Layer export TIF on leafmap

    Hi I am able to get the 03 COG STAC tutorial working using your provided tif files, but when I use the QGIS exported file, I am unable to see any bound values and when trying to run the leafmap it gives me this error

    image

    bug 
    opened by Niko-La 14
  • Generalize the titiler_endpoint parameter

    Generalize the titiler_endpoint parameter

    Currently, the default titiler_endpoint is https://api.cogeo.xyz/. It would be useful to generalize the titiler_endpointso that users can provide a custom endpoint. @TomAugspurger

    For example, Microsoft Planetary Computer has its own titiler endpoint at https://planetarycomputer.microsoft.com/api/data/v1/docs#/. Ideally, the add_cog_layer() function should be able to automatically detect if the notebook is running within Planetary Computer (e.g., import planetary-computer is successful) and use the custom endpoint.

    https://leafmap.org/leafmap/#leafmap.leafmap.Map.add_cog_layer https://leafmap.org/leafmap/#leafmap.leafmap.Map.add_cog_mosaic

    https://planetarycomputer.microsoft.com/api/data/v1

    Feature Request 
    opened by giswqs 14
  • Add support for visualizing LiDAR data

    Add support for visualizing LiDAR data

    References:

    • https://github.com/laspy/laspy
    • https://github.com/isl-org/Open3D
    • https://medium.com/spatial-data-science/an-easy-way-to-work-and-visualize-lidar-data-in-python-eed0e028996c
    Feature Request 
    opened by giswqs 11
  • plotly colab import error

    plotly colab import error

    image

    looks like colab is giving issue.

    Environment Information

    • leafmap version:
    • Python version:
    • Operating System:

    Description

    Describe what you were trying to get done. Tell us what happened, what went wrong, and what you expected to happen.

    What I Did

    Paste the command(s) you ran and the output.
    If there was a crash, please include the traceback here.
    
    bug 
    opened by Niko-La 10
  • ImageOverlay from local files

    ImageOverlay from local files

    Add a new ImageOverlay class that extends ipyleaflet.ImageOverlay for supporting local files.

    Reference: https://github.com/banesullivan/localtileserver/issues/25 @deeplook

    Feature Request 
    opened by giswqs 10
  • Added support for bokeh #298

    Added support for bokeh #298

    This PR adds bokeh as a new plotting backend. Currently, it supports adding basemaps, loading COG and local raster datasets. Supporting for loading vector data is in progress.

    import leafmap.bokehmap as leafmap
    m = leafmap.Map()
    m.add_basemap('ROADMAP')
    url = 'https://opendata.digitalglobe.com/events/california-fire-2020/pre-event/2018-02-16/pine-gulch-fire20/1030010076004E00.tif'
    m.add_cog_layer(url)
    m
    

    Peek 2022-11-07 16-06

    Feature Request 
    opened by giswqs 9
  • Added two functions to add and check styles for different type of geo…

    Added two functions to add and check styles for different type of geo…

    …metries

    Please inform me if any further changes are required. e.g:

    • m.add_geojson_layer('local_geojson_url','layer1','red')
    • m.add_geojson_layer('https://raw.githubusercontent.com/plotly/datasets/master/geojson-counties-fips.json','layer2')
    opened by rowheat02 9
  • Can't add a Geotiff raster layer to the map

    Can't add a Geotiff raster layer to the map

    Environment Information

    • leafmap version: 0.1.0
    • Python version: 3.7.10
    • Operating System: Windows

    Description

    After installing xarray-leaflet, I tried to add a Geotiff raster layer to the map.

    Once the file is chosen, I press the apply button and the map zooms to the right coordinates, a layer is created but nothing is displayed.

    I'm attaching the file I'm trying to display so you can try on your own.

    file.zip

    bug 
    opened by mamoev 9
  • style_callback param for add_geojson() not working?

    style_callback param for add_geojson() not working?

    Environment Information

    • leafmap version: 0.5.0
    • Python version: 3.9
    • Operating System: Linux/macOS

    Description

    I want to use the style_callback parameter for map.add_geojson(), but the chosen style which sets only the color seems not to be respected. I think the style dicts are the same for ipyleaflet and leafmap, at least I could not find any contradictory information. See below.

    import requests
    data = requests.get((
        "https://raw.githubusercontent.com/telegeography/www.submarinecablemap.com"
        "/master/web/public/api/v3/cable/cable-geo.json"
    )).json()
    callback = lambda feat: {"color": feat["properties"]["color"]}
    
    import leafmap
    m = leafmap.Map(center=[0, 0], zoom=2)
    m.add_geojson(data, style_callback=callback)
    m.layout.height = "100px"
    m
    
    Screen Shot 2021-10-03 at 11 12 53
    import ipyleaflet
    m = ipyleaflet.Map(center=[0, 0], zoom=2)
    m += ipyleaflet.GeoJSON(data=data, style_callback=callback)
    m.layout.height = "100px"
    m
    
    Screen Shot 2021-10-03 at 11 14 14 bug 
    opened by deeplook 8
  • get the coordinates of a user-drawn polygon

    get the coordinates of a user-drawn polygon

    First of all, congratulations Dr. Qiusheng for your fantastic work !

    I became a 100% geemap user and one of the very useful functions when working with feature exploration (1) is to manually draw a polygon in an area of interest, (2) extract the coordinates with Map.draw_last_feature and then (3) export this polygon as a shapefile or even a featureCollection in the case of ee.

    I looked for something similar in the leafmap but I couldn't find it, although it is possible to easily draw the polygon and see its individual points, but it seems to me that there is a lack of a similar routine to manipulate the coordinates extracted from the map.

    That would be of great value. Best wishes Andre

    Feature Request 
    opened by andrebelem 8
  • Input data from OGCAPI endpoints

    Input data from OGCAPI endpoints

    Description

    Allow simple connection to be vector data served from OGCAPI-Features endpoints. Potentially also OGCAPI-Tiles similar to WMS function.

    Imagined functionality: User provides endpoint and collection or juster endpoint to the collection - https://ogcapi.bgs.ac.uk/collections/bgsgeology625kbedrock

    Source code

    Potentially use OWSLib package to pull data?

    Feature Request 
    opened by KoalaGeo 1
  • Panoply netCDF, HDF and GRIB Data Viewer

    Panoply netCDF, HDF and GRIB Data Viewer

    The Panoply app is quite interesting. It would be great to have some similar functionality in leafmap.

    • https://www.giss.nasa.gov/tools/panoply/
    • http://soliton.vm.bytemark.co.uk/pub/cpt-city/
    • https://www.ventusky.com/

    image

    Feature Request 
    opened by giswqs 0
  • Making interactive hillshade maps

    Making interactive hillshade maps

    • https://github.com/banesullivan/localtileserver-demo/blob/main/hillshade.ipynb
    • https://www.neonscience.org/resources/learning-hub/tutorials/create-hillshade-py
    • https://www.whiteboxgeo.com/manual/wbt_book/available_tools/geomorphometric_analysis.html?highlight=shaded#multidirectionalhillshade
    • https://earthpy.readthedocs.io/en/latest/gallery_vignettes/plot_dem_hillshade.html
    Feature Request 
    opened by giswqs 0
  • Add support for ipybertin

    Add support for ipybertin

    ipybertin is a new mapping library. It would be great to add it as a new plotting backend.

    • https://github.com/davidbrochart/ipybertin
    • https://github.com/neocarto/bertin

    Peek 2022-06-28 11-29

    Feature Request 
    opened by giswqs 0
Releases(v0.15.0)
Owner
Qiusheng Wu
Assistant Professor of Geography at the University of Tennessee, Knoxville
Qiusheng Wu
Asynchronous Client for the worlds fastest in-memory geo-database Tile38

This is an asynchonous Python client for Tile38 that allows for fast and easy interaction with the worlds fastest in-memory geodatabase Tile38.

Ben 53 Dec 29, 2022
Manage your XYZ Hub or HERE Data Hub spaces from Python.

XYZ Spaces for Python Manage your XYZ Hub or HERE Data Hub spaces and Interactive Map Layer from Python. FEATURED IN: Online Python Machine Learning C

HERE Technologies 30 Oct 18, 2022
GetOSM is an OpenStreetMap tile downloader written in Python that is agnostic of GUI frameworks.

GetOSM GetOSM is an OpenStreetMap tile downloader written in Python that is agnostic of GUI frameworks. It is used with tkinter by ProjPicker. Require

Huidae Cho 3 May 20, 2022
Deal with Bing Maps Tiles and Pixels / WGS 84 coordinates conversions, and generate grid Shapefiles

PyBingTiles This is a small toolkit in order to deal with Bing Tiles, used i.e. by Facebook for their Data for Good datasets. Install Clone this repos

Shoichi 1 Dec 08, 2021
Raster-based Spatial Analysis for Python

🌍 xarray-spatial: Raster-Based Spatial Analysis in Python 📍 Fast, Accurate Python library for Raster Operations ⚡ Extensible with Numba ⏩ Scalable w

makepath 649 Jan 01, 2023
A Python interface between Earth Engine and xarray

eexarray A Python interface between Earth Engine and xarray Description eexarray was built to make processing gridded, mesoscale time series data quic

Aaron Zuspan 159 Dec 23, 2022
A set of utility functions for working with GeoJSON annotations in Kaibu

kaibu-utils A set of utility functions for working with Kaibu. Create a new repository Create a new repository and select imjoy-team/imjoy-python-temp

ImJoy Team 0 Dec 12, 2021
Daily social mapping project in November 2021. Maps made using PyGMT whenever possible.

Daily social mapping project in November 2021. Maps made using PyGMT whenever possible.

Wei Ji 20 Nov 24, 2022
Construct and use map tile grids in different projection.

Morecantile +-------------+-------------+ ymax | | | | x: 0 | x: 1 | | y: 0 | y: 0

Development Seed 67 Dec 23, 2022
Cloud Optimized GeoTIFF creation and validation plugin for rasterio

rio-cogeo Cloud Optimized GeoTIFF (COG) creation and validation plugin for Rasterio. Documentation: https://cogeotiff.github.io/rio-cogeo/ Source Code

216 Dec 31, 2022
A multi-page streamlit app for the geospatial community.

A multi-page streamlit app for the geospatial community.

Qiusheng Wu 522 Dec 30, 2022
Fiona reads and writes geographic data files

Fiona Fiona reads and writes geographic data files and thereby helps Python programmers integrate geographic information systems with other computer s

987 Jan 04, 2023
The geospatial toolkit for redistricting data.

maup maup is the geospatial toolkit for redistricting data. The package streamlines the basic workflows that arise when working with blocks, precincts

Metric Geometry and Gerrymandering Group 60 Dec 05, 2022
Get-countries-info - A python code that fetches data of any country

Country-info A python code getting countries information including country's map

CODE 2 Feb 21, 2022
A GUI widget for Linux to show current time in different timezones.

A GUI widget to show current time in different timezones (under development). To use this widget: Run scripts/startup.py Select a country. A list of t

B.Jothin kumar 11 Nov 10, 2022
Expose a GDAL file as a HTTP accessible on-the-fly COG

cogserver Expose any GDAL recognized raster file as a HTTP accessible on-the-fly COG (Cloud Optimized GeoTIFF) The on-the-fly COG file is not material

Even Rouault 73 Aug 04, 2022
framework for large-scale SAR satellite data processing

pyroSAR A Python Framework for Large-Scale SAR Satellite Data Processing The pyroSAR package aims at providing a complete solution for the scalable or

John Truckenbrodt 389 Dec 21, 2022
Python interface to PROJ (cartographic projections and coordinate transformations library)

pyproj Python interface to PROJ (cartographic projections and coordinate transformations library). Documentation Stable: http://pyproj4.github.io/pypr

832 Dec 31, 2022
Logging the position of the car on an sdcard

audi-mmi-3g-gps-logging Logging the position of the car on an sdcard, startup script origin not clear to me, logging setup and time change is what I d

2 May 31, 2022
Build, deploy and extract satellite public constellations with one command line.

SatExtractor Build, deploy and extract satellite public constellations with one command line. Table of Contents About The Project Getting Started Stru

Frontier Development Lab 70 Nov 18, 2022