Painlessly create beautiful matplotlib plots.

Overview

Announcement

Thank you to everyone who has used prettyplotlib and made it what it is today! Unfortunately, I no longer have the bandwidth to maintain prettyplotlib. I recommend using seaborn. Using seaborn, to get the prettyplotlib style, do:

import seaborn as sns
sns.set(style='ticks', palette='Set2')

And to remove "chartjunk", do:

sns.despine()

If you have discrete pull requests, I will accept them, but I personally will no longer fix bugs.

If you are a biological scientist looking for ways to analyze your big-ish (20+ samples) data, check out my main project, flotilla.

Build Status

prettyplotlib

Python matplotlib-enhancer library which painlessly creates beautiful default matplotlib plots. Inspired by Edward Tufte's work on information design and Cynthia Brewer's work on color perception.

I truly believe that scientific progress is impeded when improper data visualizations are used. I spent a lot of time tweaking my figures to make them more understandable, and realized the scientific world could be a better place if the default parameters for plotting libraries followed recent advances in information design research. And thus prettyplotlib was born.

Requirements:

  • matplotlib. Can be installed via pip install matplotlib or easy_install matplotlib
  • brewer2mpl. Can be installed via pip install brewer2mpl or easy_install brewer2mpl

Comparison to matplotlib

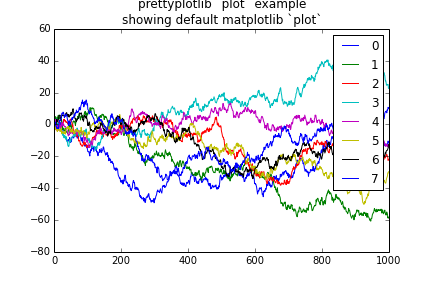
matplotlib default plot
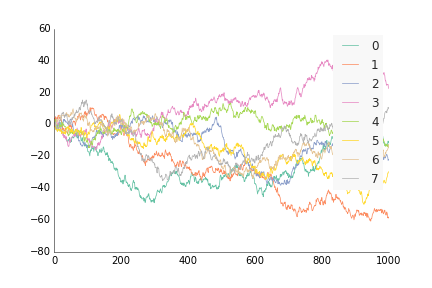
prettyplotlib default plot
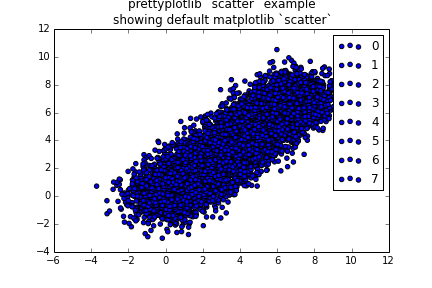
matplotlib default scatter
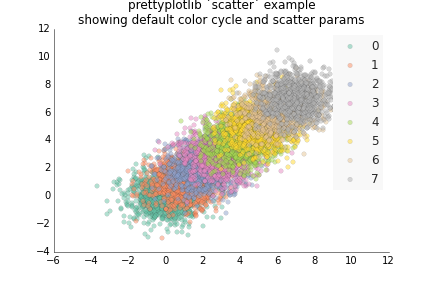
prettyplotlib default scatter
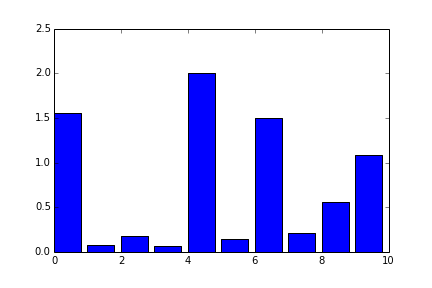
matplotlib default bar
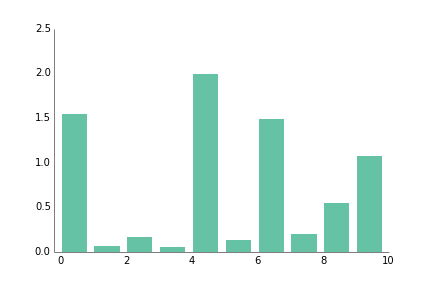
prettyplotlib default bar
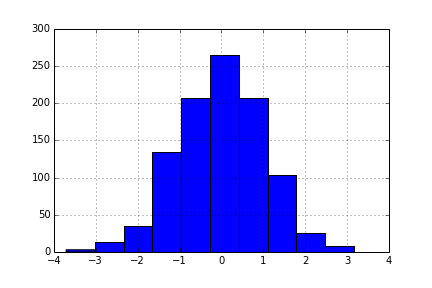
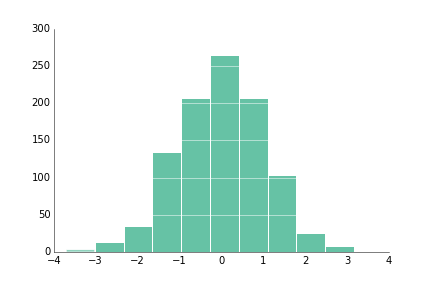
matplotlib default hist
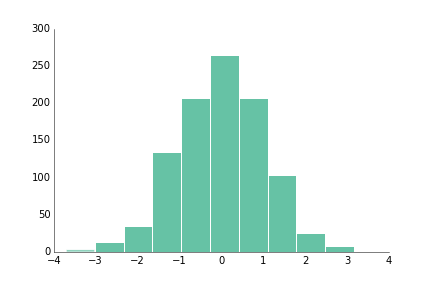
prettyplotlib default hist
matplotlib default hist
with grid
prettyplotlib default hist
with grid
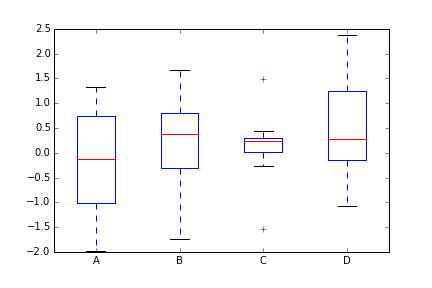
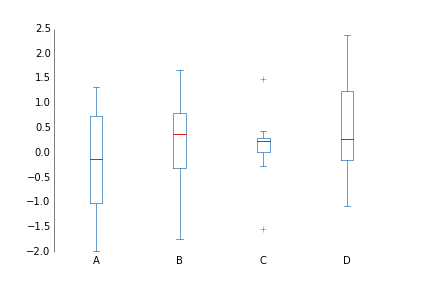
matplotlib default boxplot
prettyplotlib default boxplot
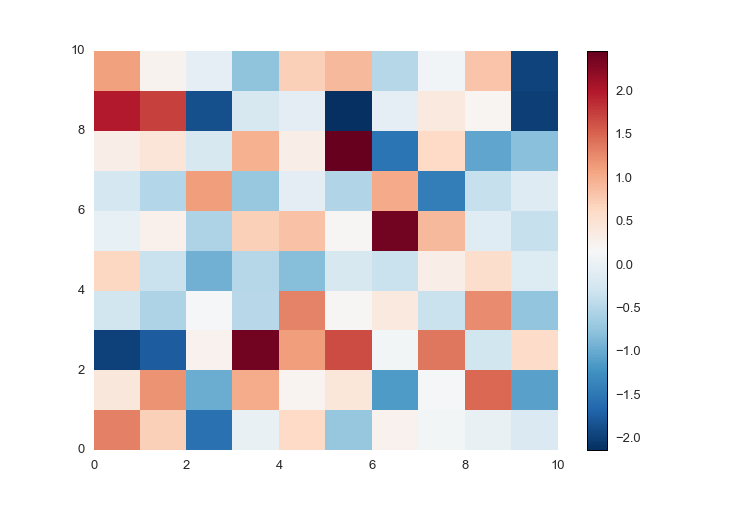
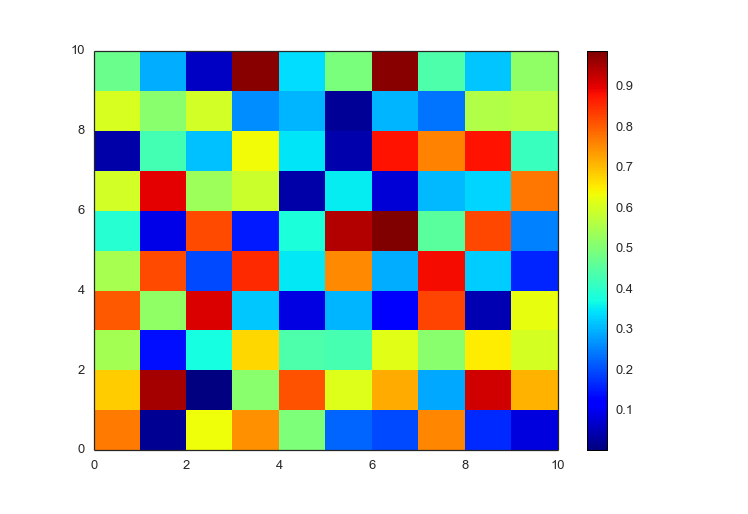
matplotlib default pcolormesh
positive and negative data
prettyplotlib default pcolormesh
positive and negative data
matplotlib default pcolormesh
positive data only
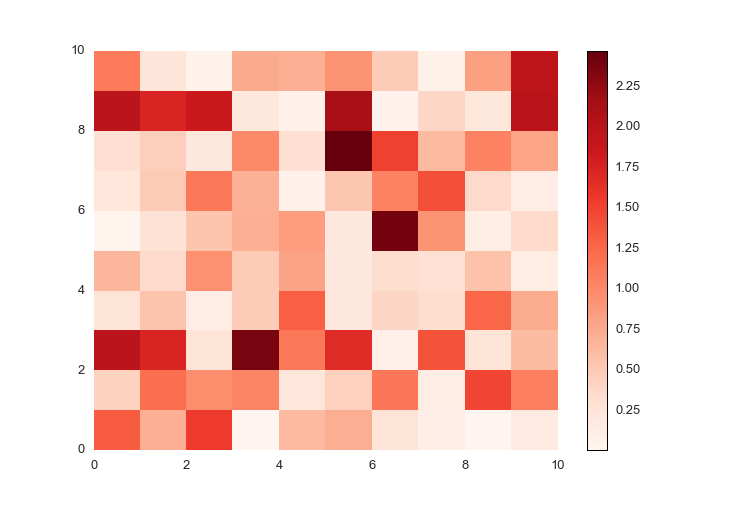
prettyplotlib default pcolormesh
positive data only
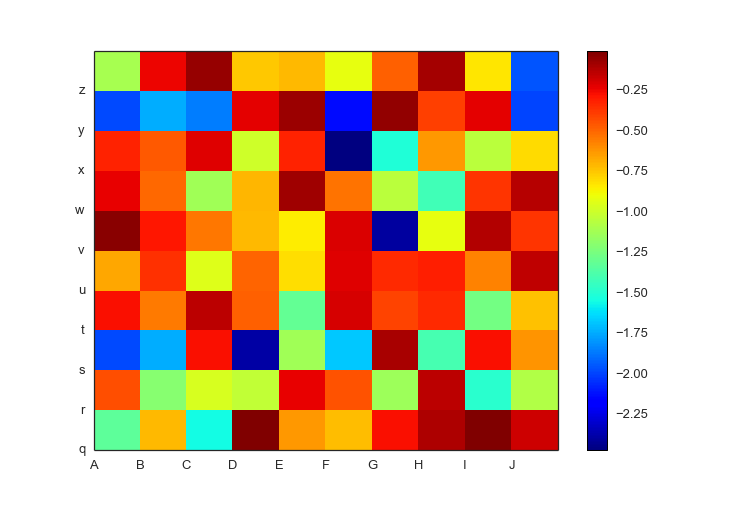
matplotlib pcolormesh
negative-valued data with labels
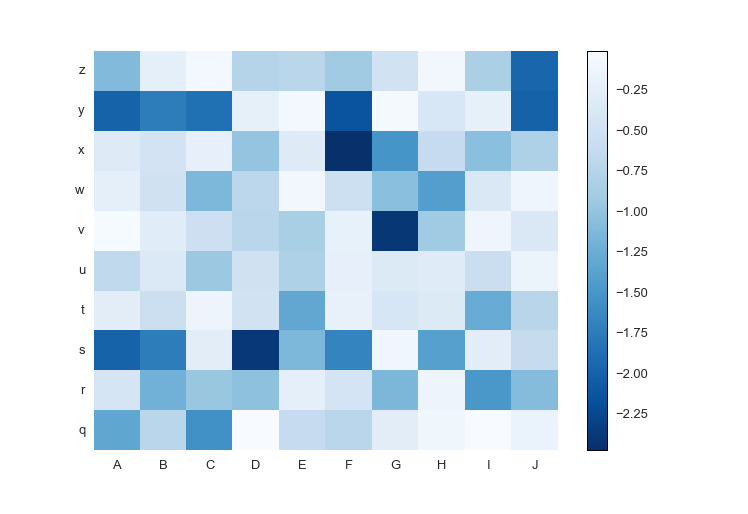
prettyplotlib pcolormesh
negative-valued data with labels

Quotes

"Dis ain't no uglyplotlib" - Anonymous

Owner
Olga Botvinnik
peppy computational biologist
Olga Botvinnik
Open-source demos hosted on Dash Gallery

Dash Sample Apps This repository hosts the code for over 100 open-source Dash apps written in Python or R. They can serve as a starting point for your

Plotly 2.7k Jan 07, 2023
Smarthome Dashboard with Grafana & InfluxDB

Smarthome Dashboard with Grafana & InfluxDB This is a complete overhaul of my Raspberry Dashboard done with Flask. I switched from sqlite to InfluxDB

6 Oct 20, 2022
mysql relation charts

sqlcharts 自动生成数据库关联关系图 复制settings.py.example 重命名为settings.py 将数据库配置信息填入settings.DATABASE,目前支持mysql和postgresql 执行 python build.py -b,-b是读取数据库表结构,如果只更新匹

6 Aug 22, 2022
A command line tool for visualizing CSV/spreadsheet-like data

PerfPlotter Read data from CSV files using pandas and generate interactive plots using bokeh, which can then be embedded into HTML pages and served by

Gino Mempin 0 Jun 25, 2022
Runtime analysis of code with plotting

Runtime analysis of code with plotting A quick comparison among Python, Cython, and the C languages A Programming Assignment regarding the Programming

Cena Ashoori 2 Dec 24, 2021
Small U-Net for vehicle detection

Small U-Net for vehicle detection Vivek Yadav, PhD Overview In this repository , we will go over using U-net for detecting vehicles in a video stream

Vivek Yadav 91 Nov 03, 2022
Peloton Stats to Google Sheets with Data Visualization through Seaborn and Plotly

Peloton Stats to Google Sheets with Data Visualization through Seaborn and Plotly Problem: 2 peloton users were looking for a way to track their metri

9 Jul 22, 2022
Minimalistic tool to visualize how the routes to a given target domain change over time, feat. Python 3.10 & mermaid.js

Minimalistic tool to visualize how the routes to a given target domain change over time, feat. Python 3.10 & mermaid.js

Péter Ferenc Gyarmati 1 Jan 17, 2022
Pglive - Pglive package adds support for thread-safe live plotting to pyqtgraph

Live pyqtgraph plot Pglive package adds support for thread-safe live plotting to

Martin Domaracký 15 Dec 10, 2022
Param: Make your Python code clearer and more reliable by declaring Parameters

Param Param is a library providing Parameters: Python attributes extended to have features such as type and range checking, dynamically generated valu

HoloViz 304 Jan 07, 2023
Fast 1D and 2D histogram functions in Python

About Sometimes you just want to compute simple 1D or 2D histograms with regular bins. Fast. No nonsense. Numpy's histogram functions are versatile, a

Thomas Robitaille 237 Dec 18, 2022
基于python爬虫爬取COVID-19爆发开始至今全球疫情数据并利用Echarts对数据进行分析与多样化展示。

COVID-19-Epidemic-Map 基于python爬虫爬取COVID-19爆发开始至今全球疫情数据并利用Echarts对数据进行分析与多样化展示。 觉得项目还不错的话欢迎给一个star! 项目的源码可以正常运行,各个库的版本、数据库的建表语句、运行过程中遇到的坑以及解决方式在笔记.md中都

31 Dec 15, 2022
DataVisualization - The evolution of my arduino and python journey. New level of competence achieved

DataVisualization - The evolution of my arduino and python journey. New level of competence achieved

1 Jan 03, 2022
Resources for teaching & learning practical data visualization with python.

Practical Data Visualization with Python Overview All views expressed on this site are my own and do not represent the opinions of any entity with whi

Paul Jeffries 98 Sep 24, 2022
Backend app for visualizing CANedge log files in Grafana (directly from local disk or S3)

CANedge Grafana Backend - Visualize CAN/LIN Data in Dashboards This project enables easy dashboard visualization of log files from the CANedge CAN/LIN

13 Dec 15, 2022
Simple CLI python app to show a stocks graph performance. Made with Matplotlib and Tiingo.

stock-graph-python Simple CLI python app to show a stocks graph performance. Made with Matplotlib and Tiingo. Tiingo API Key You will need to add your

Toby 3 May 14, 2022
Tidy data structures, summaries, and visualisations for missing data

naniar naniar provides principled, tidy ways to summarise, visualise, and manipulate missing data with minimal deviations from the workflows in ggplot

Nicholas Tierney 611 Dec 22, 2022
Data Visualizer for Super Mario Kart (SNES)

Data Visualizer for Super Mario Kart (SNES)

MrL314 21 Nov 20, 2022
✅ Today I Learn

Today I Learn EDA numpy_100ex numpy_0~10 airline_satisfaction_prediction BERT_naver_movie_classification NLP_prepare NLP_Tweet_Emotion_Recognition tex

Yeonghoo_Ahn 3 Dec 15, 2022
University of Missouri - Kansas City: CS451R: Capstone

CS451RC University of Missouri - Kansas City: CS451R: Capstone Installation cd git clone https://github.com/ala2q6/CS451RC.git cd CS451RC pip3 instal

Alex Arbuckle 1 Nov 17, 2021