Insert SVGs into matplotlib

Overview

skunk buildPyPI version

Insert SVGs into matplotlib

pip install skunk

Jupyter Notebooks

To show generated SVGs in Jupyter Notebooks: Currently, axes are cutoff when viewed in jupyter - I think due to restrictive viewport. Save to file to get publication ready version

skunk.display(svg)

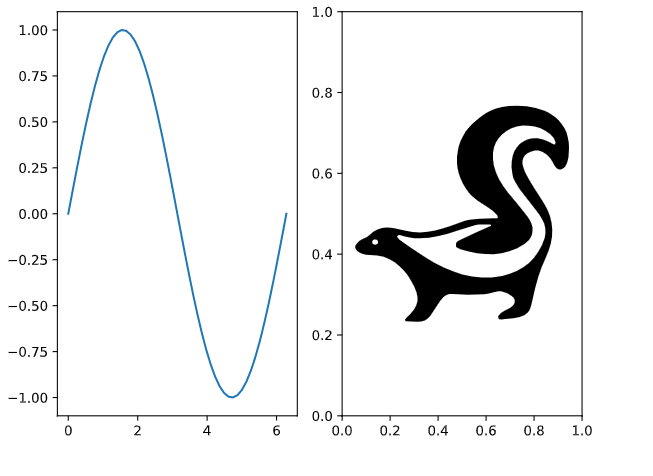
Overwrite Subplot

import skunk
import numpy as np
import os
import matplotlib.pyplot as plt

fig, axs = plt.subplots(ncols=2)

x = np.linspace(0, 2 * np.pi)
axs[0].plot(x, np.sin(x))

# important line where we set ID
skunk.connect(axs[1], 'sk')

plt.tight_layout()

# Overwrite using file path to my svg
# Can also use string
svg = skunk.insert(
    {
        'sk': 'skunk.svg'
    })

with open('replaced.svg', 'w') as f:
    f.write(svg)

Output

image

SVG in Annotation

Read about annotation boxes first

")) ax.add_artist(ab) # sknunk box with id sk2 box = skunk.Box(50, 50, 'sk2') ab = AnnotationBbox(box, (3 * np.pi / 2, -1), xybox=(-5, 100), xycoords='data', boxcoords='offset points', arrowprops=dict(arrowstyle="->")) ax.add_artist(ab) # insert current figure into itself at sk1 # insert svg file in sk2 svg = skunk.insert( { 'sk1': skunk.pltsvg(), 'sk2': 'skunk.svg' }) with open('replaced2.svg', 'w') as f: f.write(svg) ">
import numpy as np

fig, ax = plt.subplots()

x = np.linspace(0, 2 * np.pi)
ax.plot(x, np.sin(x))

# new code: using skunk box with id sk1
box = skunk.Box(50, 50, 'sk1')
ab = AnnotationBbox(box, (np.pi / 2, 1),
                    xybox=(-5, -100),
                    xycoords='data',
                    boxcoords='offset points',
                    arrowprops=dict(arrowstyle="->"))
ax.add_artist(ab)

# sknunk box with id sk2
box = skunk.Box(50, 50, 'sk2')
ab = AnnotationBbox(box, (3 * np.pi / 2, -1),
                    xybox=(-5, 100),
                    xycoords='data',
                    boxcoords='offset points',
                    arrowprops=dict(arrowstyle="->"))

ax.add_artist(ab)

# insert current figure into itself at sk1
# insert svg file in sk2
svg = skunk.insert(
    {
        'sk1': skunk.pltsvg(),
        'sk2': 'skunk.svg'
    })

with open('replaced2.svg', 'w') as f:
    f.write(svg)

Output

image

You might also like...
matplotlib: plotting with Python

Matplotlib is a comprehensive library for creating static, animated, and interactive visualizations in Python. Check out our home page for more inform

Statistical data visualization using matplotlib

seaborn: statistical data visualization Seaborn is a Python visualization library based on matplotlib. It provides a high-level interface for drawing

:small_red_triangle: Ternary plotting library for python with matplotlib

python-ternary This is a plotting library for use with matplotlib to make ternary plots plots in the two dimensional simplex projected onto a two dime

Joyplots in Python with matplotlib & pandas :chart_with_upwards_trend:

JoyPy JoyPy is a one-function Python package based on matplotlib + pandas with a single purpose: drawing joyplots (a.k.a. ridgeline plots). The code f

A python package for animating plots build on matplotlib.

animatplot A python package for making interactive as well as animated plots with matplotlib. Requires Python = 3.5 Matplotlib = 2.2 (because slider

Painlessly create beautiful matplotlib plots.

Announcement Thank you to everyone who has used prettyplotlib and made it what it is today! Unfortunately, I no longer have the bandwidth to maintain

basemap - Plot on map projections (with coastlines and political boundaries) using matplotlib.

Basemap Plot on map projections (with coastlines and political boundaries) using matplotlib. ⚠️ Warning: this package is being deprecated in favour of

Design your own matplotlib stylefile interactively

Tired of playing with font sizes and other matplotlib parameters every time you start a new project or write a new plotting function? Want all you plots have the same style? Use matplotlib configuration files!

A Python library for plotting hockey rinks with Matplotlib.

Hockey Rink A Python library for plotting hockey rinks with Matplotlib. Installation pip install hockey_rink Current Rinks The following shows the cus

Comments
  • plot svgs into matplotlib subplots in a for loop

    plot svgs into matplotlib subplots in a for loop

    Hi,

    Many thanks for this easy and straightforward tool. I have a dict with lxml text in it, and I want to plot each key into a subplot. How would you do that using skunk?.. I would be very grateful if you can provide a demo code.

    I played a little with your code, didn't manage to make what I am after, but I saw that I had to reset the dimensions of the svg image before adding it to a subplot.

    Many thanks in advance, HM

    opened by hmassalha 4
Releases(v1.2.0)
Owner
Andrew White
Andrew White
The Metabolomics Integrator (MINT) is a post-processing tool for liquid chromatography-mass spectrometry (LCMS) based metabolomics.

MINT (Metabolomics Integrator) The Metabolomics Integrator (MINT) is a post-processing tool for liquid chromatography-mass spectrometry (LCMS) based m

Sören Wacker 0 May 04, 2022
Geocoding library for Python.

geopy geopy is a Python client for several popular geocoding web services. geopy makes it easy for Python developers to locate the coordinates of addr

geopy 3.8k Jan 02, 2023
CONTRIBUTIONS ONLY: Voluptuous, despite the name, is a Python data validation library.

CONTRIBUTIONS ONLY What does this mean? I do not have time to fix issues myself. The only way fixes or new features will be added is by people submitt

Alec Thomas 1.8k Dec 31, 2022
Missing data visualization module for Python.

missingno Messy datasets? Missing values? missingno provides a small toolset of flexible and easy-to-use missing data visualizations and utilities tha

Aleksey Bilogur 3.4k Dec 29, 2022
A deceptively simple plotting library for Streamlit

🍅 Plost A deceptively simple plotting library for Streamlit. Because you've been writing plots wrong all this time. Getting started pip install plost

Thiago Teixeira 192 Dec 29, 2022
Epagneul is a tool to visualize and investigate windows event logs

epagneul Epagneul is a tool to visualize and investigate windows event logs. Dep

jurelou 190 Dec 13, 2022
Declarative statistical visualization library for Python

Altair http://altair-viz.github.io Altair is a declarative statistical visualization library for Python. With Altair, you can spend more time understa

Altair 8k Jan 05, 2023
🗾 Streamlit Component for rendering kepler.gl maps

streamlit-keplergl 🗾 Streamlit Component for rendering kepler.gl maps in a streamlit app. 🎈 Live Demo 🎈 Installation pip install streamlit-keplergl

Christoph Rieke 39 Dec 14, 2022
:bowtie: Create a dashboard with python!

Installation | Documentation | Gitter Chat | Google Group Bowtie Introduction Bowtie is a library for writing dashboards in Python. No need to know we

Jacques Kvam 753 Dec 22, 2022
SummVis is an interactive visualization tool for text summarization.

SummVis is an interactive visualization tool for analyzing abstractive summarization model outputs and datasets.

Robustness Gym 246 Dec 08, 2022
Data Visualizer for Super Mario Kart (SNES)

Data Visualizer for Super Mario Kart (SNES)

MrL314 21 Nov 20, 2022
finds grocery stores and stuff next to route (gpx)

Route-Report Route report is a command-line utility that can be used to locate points-of-interest near your planned route (gpx). The results are based

Clemens Mosig 5 Oct 10, 2022
Tidy data structures, summaries, and visualisations for missing data

naniar naniar provides principled, tidy ways to summarise, visualise, and manipulate missing data with minimal deviations from the workflows in ggplot

Nicholas Tierney 611 Dec 22, 2022
Visualization Library

CamViz Overview // Installation // Demos // License Overview CamViz is a visualization library developed by the TRI-ML team with the goal of providing

Toyota Research Institute - Machine Learning 67 Nov 24, 2022
Plotting library for IPython/Jupyter notebooks

bqplot 2-D plotting library for Project Jupyter Introduction bqplot is a 2-D visualization system for Jupyter, based on the constructs of the Grammar

3.4k Dec 29, 2022
https://there.oughta.be/a/macro-keyboard

inkkeys Details and instructions can be found on https://there.oughta.be/a/macro-keyboard In contrast to most of my other projects, I decided to put t

Sebastian Staacks 209 Dec 21, 2022
Scientific measurement library for instruments, experiments, and live-plotting

PyMeasure scientific package PyMeasure makes scientific measurements easy to set up and run. The package contains a repository of instrument classes a

PyMeasure 445 Jan 04, 2023
Fast data visualization and GUI tools for scientific / engineering applications

PyQtGraph A pure-Python graphics library for PyQt5/PyQt6/PySide2/PySide6 Copyright 2020 Luke Campagnola, University of North Carolina at Chapel Hill h

pyqtgraph 3.1k Jan 08, 2023
Time series visualizer is a flexible extension that provides filling world map by country from real data.

Time-series-visualizer Time series visualizer is a flexible extension that provides filling world map by country from csv or json file. You can know d

Long Ng 3 Jul 09, 2021
Make your BSC transaction simple.

bsc_trade_history Make your BSC transaction simple. 中文ReadMe Background: inspired by debank ,Practice my hands on this small project Blog:Crypto-BscTr

foolisheddy 7 Jul 06, 2022