A Python wrapper of Neighbor Retrieval Visualizer (NeRV)

Overview

PyNeRV

A Python wrapper of the dimensionality reduction algorithm Neighbor Retrieval Visualizer (NeRV)

Compile

Set up the paths in Makefile then make.

Usage example

import numpy as np
import matplotlib.pyplot as plt
from nerv import NeRV

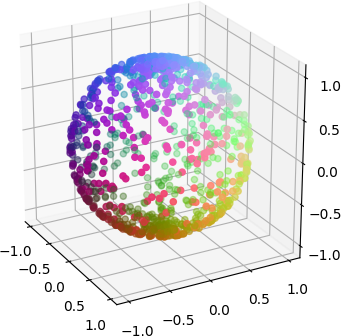
data = np.genfromtxt('dredviz-1.0.2/spheredata.dat', skip_header=1)
color = np.genfromtxt('dredviz-1.0.2/spheredata.col', skip_header=1)
nerv_obj = NeRV(random_state=0)
nerv_obj.fit(data)
print('Final cost = %g' % nerv_obj.cost_)
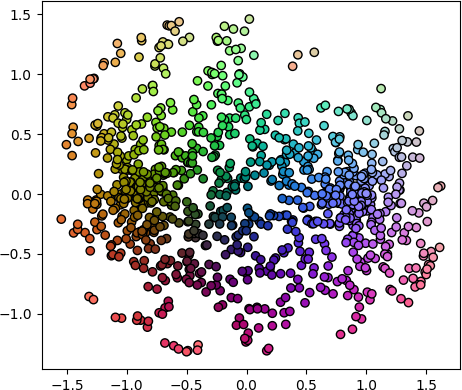
plt.scatter(*nerv_obj.embedding_.T, c=color)
plt.show()

which shows (right)


Reference

@article{venna2010information,
  title={Information retrieval perspective to nonlinear dimensionality reduction for data visualization},
  author={Venna, Jarkko and Peltonen, Jaakko and Nybo, Kristian and Aidos, Helena and Kaski, Samuel},
  journal={Journal of Machine Learning Research},
  volume={11},
  number={Feb},
  pages={451--490},
  year={2010}
}
LabGraph is a a Python-first framework used to build sophisticated research systems with real-time streaming, graph API, and parallelism.

LabGraph is a a Python-first framework used to build sophisticated research systems with real-time streaming, graph API, and parallelism.

MLH Fellowship 7 Oct 05, 2022
A Python toolbox for gaining geometric insights into high-dimensional data

"To deal with hyper-planes in a 14 dimensional space, visualize a 3D space and say 'fourteen' very loudly. Everyone does it." - Geoff Hinton Overview

Contextual Dynamics Laboratory 1.8k Dec 29, 2022
Scientific measurement library for instruments, experiments, and live-plotting

PyMeasure scientific package PyMeasure makes scientific measurements easy to set up and run. The package contains a repository of instrument classes a

PyMeasure 445 Jan 04, 2023
📊 Charts with pure python

A zero-dependency python package that prints basic charts to a Jupyter output Charts supported: Bar graphs Scatter plots Histograms 🍑 📊 👏 Examples

Max Humber 54 Oct 04, 2022
Here are my graphs for hw_02

Let's Have A Look At Some Graphs! Graph 1: State Mentions in Congressperson's Tweets on 10/01/2017 The graph below uses this data set to demonstrate h

7 Sep 02, 2022
Backend app for visualizing CANedge log files in Grafana (directly from local disk or S3)

CANedge Grafana Backend - Visualize CAN/LIN Data in Dashboards This project enables easy dashboard visualization of log files from the CANedge CAN/LIN

13 Dec 15, 2022
A simple python tool for explore your object detection dataset

A simple tool for explore your object detection dataset. The goal of this library is to provide simple and intuitive visualizations from your dataset and automatically find the best parameters for ge

GRADIANT - Centro Tecnolóxico de Telecomunicacións de Galicia 142 Dec 25, 2022
This is a learning tool and exploration app made using the Dash interactive Python framework developed by Plotly

Support Vector Machine (SVM) Explorer This app has been moved here. This repo is likely outdated and will not be updated. This is a learning tool and

Plotly 150 Nov 03, 2022
The interactive graphing library for Python (includes Plotly Express) :sparkles:

plotly.py Latest Release User forum PyPI Downloads License Data Science Workspaces Our recommended IDE for Plotly’s Python graphing library is Dash En

Plotly 12.7k Jan 05, 2023
Visualizations of some specific solutions of different differential equations.

Diff_sims Visualizations of some specific solutions of different differential equations. Heat Equation in 1 Dimension (A very beautiful and elegant ex

2 Jan 13, 2022
Example Code Notebooks for Data Visualization in Python

This repository contains sample code scripts for creating awesome data visualizations from scratch using different python libraries (such as matplotli

Javed Ali 27 Jan 04, 2023
HW 02 for CS40 - matplotlib practice

HW 02 for CS40 - matplotlib practice project instructions https://github.com/mikeizbicki/cmc-csci040/tree/2021fall/hw_02 Drake Lyric Analysis Bar Char

13 Oct 27, 2021
Open-source demos hosted on Dash Gallery

Dash Sample Apps This repository hosts the code for over 100 open-source Dash apps written in Python or R. They can serve as a starting point for your

Plotly 2.7k Jan 07, 2023
Political elections, appointment, analysis and visualization in Python

Political elections, appointment, analysis and visualization in Python poli-sci-kit is a Python package for political science appointment and election

Andrew Tavis McAllister 9 Dec 01, 2022
demir.ai Dataset Operations

demir.ai Dataset Operations With this application, you can have the empty values (nan/null) deleted or filled before giving your dataset to machine le

Ahmet Furkan DEMIR 8 Nov 01, 2022
Generate knowledge graphs with interesting geometries, like lattices

Geometric Graphs Generate knowledge graphs with interesting geometries, like lattices. Works on Python 3.9+ because it uses cool new features. Get out

Charles Tapley Hoyt 5 Jan 03, 2022
Python scripts to manage Chia plots and drive space, providing full reports. Also monitors the number of chia coins you have.

Chia Plot, Drive Manager & Coin Monitor (V0.5 - April 20th, 2021) Multi Server Chia Plot and Drive Management Solution Be sure to ⭐ my repo so you can

338 Nov 25, 2022
Small project to recursively calculate and plot each successive order of the Hilbert Curve

hilbert-curve Small project to recursively calculate and plot each successive order of the Hilbert Curve. After watching 3Blue1Brown's video on Hilber

Stefan Mejlgaard 2 Nov 15, 2021
This tool is designed to help administrators get an overview of their Active Directory structure.

This tool is designed to help administrators get an overview of their Active Directory structure. In the group view you can see all elements of an AD (OU, USER, GROUPS, COMPUTERS etc.). In the user v

deexno 2 Oct 30, 2022
Time series visualizer is a flexible extension that provides filling world map by country from real data.

Time-series-visualizer Time series visualizer is a flexible extension that provides filling world map by country from csv or json file. You can know d

Long Ng 3 Jul 09, 2021