当前位置:网站首页>Matlab learning notes - calculate eigenvectors and manually execute PCA
Matlab learning notes - calculate eigenvectors and manually execute PCA
2022-04-22 20:24:00 【bashendixie5】
1、 Problem description
Usually , Features are relevant . for example , Consider that we want to use the red color of each pixel in the image 、 The green and blue components are used to classify the images ( For example, detect dogs and cats ) The situation of . The image sensor most sensitive to red light will also capture some blue and green light .
Here we generate random data and plot 3D data , Principal component analysis is then performed to decorrelate the data , And reduce the dimension of feature space .
Please note that ,matlab Have the ability to execute PCA The optimization function of :princomp(). however , In our script , We do this manually by calculating the eigenvectors PCA, For demonstration purposes .
2、 Create random data
We created 334 Random data points .
clear all;
close all;

%  Create random points
s = [2 2 2];  %  skewness factor
x = randn(334,1);
y1 = normrnd(s(1).*x,1)+3;
y2 = normrnd(s(2).*x,1)+2;
y3 = normrnd(s(3).*x,1)+1;
data = [y1 y2 y3];
3、 visualization 3D data
We first draw the raw data points , Then calculate the eigenvector and eigenvalue , Then draw the feature vector .
%%%%%%%%%%%%%  Drawing raw data  %%%%%%%%%%%
%  Get the coordinates of the data mean
avg = mean(data);
X0=avg(1);
Y0=avg(2);
Z0=avg(3);

%  Drawing raw data
scatter3(data(:,1), data(:,2), data(:,3), 5, data(:,3), 'filled');
colormap(gray);

%  Calculate eigenvectors and eigenvalues
covariance = cov(data);
[eigenvec, eigenval ] = eig(covariance);

%  Get the index of the largest eigenvector
largest_eigenvec = eigenvec(:, 3);
largest_eigenval = eigenval(3,3);
medium_eigenvec = eigenvec(:, 2);
medium_eigenval = eigenval(2,2);
smallest_eigenvec = eigenvec(:, 1);
smallest_eigenval = eigenval(1,1);

%  Draw feature vectors
hold on;
quiver3(X0, Y0, Z0, largest_eigenvec(1)*sqrt(largest_eigenval), largest_eigenvec(2)*sqrt(largest_eigenval), largest_eigenvec(3)*sqrt(largest_eigenval), '-m', 'LineWidth',3);
quiver3(X0, Y0, Z0, medium_eigenvec(1)*sqrt(medium_eigenval), medium_eigenvec(2)*sqrt(medium_eigenval), medium_eigenvec(3)*sqrt(medium_eigenval), '-g', 'LineWidth',3);
quiver3(X0, Y0, Z0, smallest_eigenvec(1)*sqrt(smallest_eigenval), smallest_eigenvec(2)*sqrt(smallest_eigenval), smallest_eigenvec(3)*sqrt(smallest_eigenval), '-r', 'LineWidth',3);
hold on;

%  Set axis labels
hXLabel = xlabel('x');
hYLabel = ylabel('y');
hZLabel = zlabel('z');
%Xlim([-10,10]);
%Ylim([-10,10]);
%Zlim([-10,10]);
title(' original 3D data ');
Visualization results , We can see the raw data and eigenvectors

4、 Draw decorrelated data
Here we concentrate the data 、 Normalization , To be relevant , Then redraw .
%%%%%%%%%%%%%  Centralized data  %%%%%%%%%%%
data = data-repmat(avg, size(data, 1), 1);

%%%%%%%%%%%%%  Standardize data  %%%%%%%%%%%
stdev = sqrt(diag(covariance));
data = data./repmat(stdev', size(data, 1), 1);

%%%%%%%%%%%%%  Decorrelation data  %%%%%%%%%%%
decorrelateddata = (data*eigenvec);

%  Draw decorrelated data
figure;
scatter3(decorrelateddata(:,1), decorrelateddata(:,2), decorrelateddata(:,3), 5, decorrelateddata(:,3), 'filled');
colormap(gray);

%  Draw feature vectors  ( Now it's the axis  (0,0,1), (0,1,0), (1,0,0)
%  The average value of the centered data is  (0,0,0)
hold on;
quiver3(0, 0, 0, 0, 0, 1*sqrt(largest_eigenval), '-m', 'LineWidth',3);
quiver3(0, 0, 0, 0, 1*sqrt(medium_eigenval), 0, '-g', 'LineWidth',3);
quiver3(0, 0, 0, 1*sqrt(smallest_eigenval), 0, 0, '-r', 'LineWidth',3);
hold on;

% Set the axis labels
hXLabel = xlabel('x');
hYLabel = ylabel('y');
hZLabel = zlabel('z');
%Xlim([-5,5]);
%Ylim([-5,5]);
%Zlim([-5,5]);
title(' Decorrelated 3D data ');
Visual decorrelation data

5、 Reduce the dimension of data to 2D
Here we only take the first two principal components , And then visualize .
%%%%%%%%%%%%%  Project data to 2 On the largest eigenvector  %%%%%%%%%%%
eigenvec_2d=eigenvec(:,2:3);

data_2d = data*eigenvec_2d;

% Plot the 2D data
figure;
scatter(data_2d(:,1), data_2d(:,2), 5, data(:,3), 'filled');
colormap(gray);

% Plot the eigenvectors
hold on;
quiver(0, 0, 0*sqrt(largest_eigenval), 1*sqrt(largest_eigenval), '-m', 'LineWidth',3);
quiver(0, 0, 1*sqrt(medium_eigenval), 0*sqrt(medium_eigenval), '-g', 'LineWidth',3);
hold on;

% Set the axis labels
hXLabel = xlabel('x');
hYLabel = ylabel('y');
%Xlim([-5,5]);
%Ylim([-5,5]);
title('Projected 2D data');
grid on;
The visualization is as follows

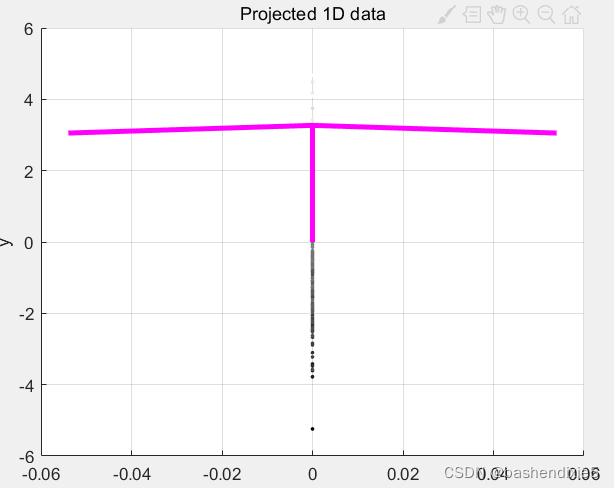
6、 Reduce the dimension of data to 1D
Here we only keep the largest , First eigenvector
%%%%%%%%%%%%%  Project the data onto the largest eigenvector  %%%%%%%%%%%

eigenvec_1d=eigenvec(:,3);

data_1d = data*eigenvec_1d;

% Plot the 1D data
figure;
scatter(repmat(0, size(data_1d,1), 1), data_1d, 5, data(:,3), 'filled');
colormap(gray);

% Plot the eigenvector
hold on;
quiver(0, 0, 0*sqrt(largest_eigenval), 1*sqrt(largest_eigenval), '-m', 'LineWidth',3);
hold on;

% Set the axis labels
hXLabel = xlabel('x');
hYLabel = ylabel('y');
%Xlim([-5,5]);
%Ylim([-5,5]);
title('Projected 1D data');
grid on;
The visualization is as follows
版权声明
本文为[bashendixie5]所创,转载请带上原文链接,感谢
https://yzsam.com/2022/04/202204222022035909.html
边栏推荐
- Add / remove / filter / sort array elements
- 微服务高性能高可用架构设计
- 运维(33) CentOS7.6通过Kubeadm部署Kubernetes集群
- Dynamic database tool -- database inspector
- Adobe系列错误代码解决方案汇总
- Error running ‘JeecgSystemApplication‘: Command line is too long. Shorten command line for JeecgSyst
- SCI/SSCI期刊列表已更新,这几本期刊被剔除~
- 木瓜移动课堂:产品更新,Facebook新增素材预审功能,力控广告违规~
- MATLAB学习笔记 - 计算特征向量手动执行PCA
- ssm框架复习
猜你喜欢

TikTok+Shopify独立站测评,卖家新风口.

396. Rotation function (mathematical law + iterative method)

day29

Connection method of Jincang database kingbasees

7-1 C语言程序设计 实验6-3 单向链表的插入 (30 分)

Activity Result API 使用与源码分析

Dynamic database tool -- database inspector
你所谓的安逸,正在慢慢毁掉你!
October's Android interview failed miserably in byte three, and fortunately won Xiaomi offer

Postman tests the correct posture of array, list and map input APIs

随机推荐
Incorrect string value: ‘\xF0\x9F\x92\x95\’
Solve the problem that kingbasees cannot open the lock file
Boot implementation of IAP
C process runs the asynchronous echo of CMD command
Application of C language bit field -- storing eight flag bits in one byte
The WiFi next door, I break every second
Panyu maritime department has solidly promoted the 100 day action of safety education and training for water practitioners
【dfs】386. 字典序排数
October's Android interview failed miserably in byte three, and fortunately won Xiaomi offer
时间戳转换
MySQL troubleshooting information query (continuous update)
DA14580作为server发送数据
[unity] pit records of Luna playable plug-ins that can play advertisements
06. Refactoring - simplifying conditional expressions
STM32 uses USB virtual serial port + ymodem to upgrade IAP
FPGA中的D触发器
leetcode222、完全二叉树的节点个数
MySQL query data within a radius length of latitude and longitude
PHP 零基础入门笔记(11):字符串 String
Acrobat Pro DC tutorial, how to use password to protect PDF files?