当前位置:网站首页>[software test series 12] stress test report template
[software test series 12] stress test report template
2022-04-21 12:00:00 【Goodbye, Monkey King_】
Catalog
1.1 Purpose of writing and audience
1.2 Project background and test purpose
2 Test content and scheme
2.2 The pressure test passed the standard
2.6 Test time and personnel arrangement
3 Test results and process
4 Detailed test process and results
4.2 home page ( My receipt 、 To do 、 Have done 、 It's done )
1 summary
1.1 Purpose of writing and audience
This test report is *** Make a test summary report on the pressure of the system , The purpose is to summarize the test results , Analyze system performance , Describe whether the system meets the expected performance requirements or other customer requirements .
The intended audience of this report includes users 、 Testers 、 Developer 、 project manager 、 Quality management personnel and other relevant personnel .
1.2 Project background and test purpose
This test is for *** Stress tests conducted by the project . In order to ensure the smooth operation of the system , It is necessary to stress test the key nodes of the system , Verify that the hardware resources and architecture of the existing production environment meet the future business needs .
This stress test focuses on end-to-end business testing from the perspective of users .
The main purpose of this pressure test is as follows :
ü Evaluate the impact of system usage on application servers under concurrent pressure 、 Resource consumption of database server , At the same time, the key performance of the system is verified
ü Identify performance bottlenecks , To optimize and adjust the system , Put forward the corresponding scheme
ü Identify fault tolerance , To identify system anomalies 、 Process to optimize and adjust , Enhance the stability of the application
2 Test content and scheme
2.1 Test requirements
The scope of this test is *** The core module of the system . To verify the data processing capacity and bearing capacity of the system under heavy load , Simulate the single point login of the reimbursement system 、 Take the reimbursement form as an example , Simulate related operations ( preservation 、 Submit ) etc. ** There are three business scenarios , From the response time 、 Transaction success rate 、CPU Usage rate 、 Analyze the results from the dimensions of memory usage .
2.2 The pressure test passed the standard
| Number of concurrent users |
Duration of pressure measurement |
90% The corresponding time of the user |
Mean response time (s) |
Transaction success rate |
Transactions processed per second |
CPU Occupancy rate |
Memory usage |
| 5000 |
15min |
Less than 3 second |
Less than 3 second |
Greater than 99% |
Less than 75% |
Less than 75% |
|
| 10000 |
15min |
Less than 4 second |
Less than 4 second |
Greater than 99% |
Less than 75% |
Less than 75% |
|
| 15000 |
15min |
Less than 5 second |
Less than 5 second |
Greater than 99% |
Less than 75% |
Less than 76% |
2.3 Test environment
| Servers and clients |
hardware configuration |
software configuration |
| application server (* platform ) |
Single node configuration : CPU:* nucleus , Memory :*GB ( Cluster total ) To configure : CPU:* nucleus , Memory :*GB Running environment :***(Docker Containers ) |
operating system : (CentOS 7.4) |
| database server (*** colony ) |
(** colony ) To configure : Storage :*TB (SSD) (** colony ) To configure : Storage :*TB (SSD) (** colony ) To configure : Storage :**TB |
operating system : (CentOS 7.4) database :(Oracle 11g) |
| Test client |
CPU:* nucleus , Memory :*G, Storage :*GB |
operating system :(windows2008R2) |
| Network requirements |
***M bandwidth |
|
2.4 Testing tools
LoadRunner Performance testing tools 、Nmon Server indicator monitoring tool 、Postman Interface testing tool 、Fiddler Caught tools
2.5 Test plan
Application service cluster is based on (**) The container is deployed on the cloud platform , The application cluster can be manually expanded by the number of nodes , This pressure measurement is set with * Nodes , Single (**) The configuration of the container node is *CPU、*GB Memory , Application service cluster adopts (**) As the first layer of load , from (**) As the second layer load, provide external services .
Relational database adopts (**) The cluster provides data storage services , The application establishes a connection with the database through the connection pool . Hot data usage (**) cache , The asynchronous processing of integration interface and application program adopts *** The way .
The stress test client adopts ** individual LoadRunner The client forms a pressure measurement cluster , Simulate the number of users and concurrent users according to the test scenario .
2.6 Test time and personnel arrangement
| scene |
Starting time |
End time |
Testers |
3 Test results and process
3.1 test result
The statistical analysis of each scene data is as follows :
| scene |
Number of concurrent users |
Duration of pressure measurement |
90% User response time (s) |
Mean response time (s) |
Transaction success rate |
Transactions processed per second |
The number of successful things |
The number of failed things |
Number of script run errors |
3.2 Conclusion
Based on the current test results , Compare our pressure measurement standards , test )***! At present, it can meet about **** Concurrent users , about ***—*** People online , Completely ** Can meet customer needs .
4 Detailed test process and results
4.1 Sign in
4.1.1 The scene that
The login scenario simulates the process of creating and submitting a general reimbursement document after a user logs in to the system . Separately and concurrently simulate 100、200、500 The user submits a general reimbursement document , Duration is 15 minute , The monitoring index is response time , Transaction success rate , The server cpu And memory usage, etc .
4.1.2 The test case
The table below for 100、200、500 Test cases for the applicant to submit reimbursement documents separately :
| Use case name |
50、100 People log in to the system at the same time |
Use case number |
001 |
| testing procedure |
1、 The user logs in to the reimbursement system , Enter the main operation interface . |
||
| Scene design |
1、 Start every second 5 Virtual users , A total of generated 50、100 Virtual users ; |
||
| Focus on business |
Sign in |
||
| Monitoring indicators |
response time , Number of successful transactions , The server cpu, Memory usage |
||
| Expected results |
Response time is less than 5 second , The transaction success rate is greater than 99%,cpu The utilization rate is less than 75%, Memory usage is less than 75%. |
||
4.1.3 test result
| scene |
Number of concurrent users |
Duration of pressure measurement |
90% User response time (s) |
Mean response time (s) |
Transaction success rate |
Transactions processed per second |
The number of successful things |
The number of failed things |
Number of script run errors |
| Sign in |
100 |
15min |
4.625 |
2.391 |
99.28% |
9.371 |
14358 |
103 |
205 |
| 200 |
15min |
6.039 |
3.753 |
98.19% |
9.125 |
18770 |
345 |
523 |
|
| 500 |
15 min |
12.748 |
6.452 |
91.18 |
10.621 |
36134 |
3493 |
5261 |
(1) 100 Users log in at the same time
1) The successful running
2) Summary report
3) Transactions processed per second
4)CPU And memory
(2) 200 Users log in at the same time
5) The successful running
6) Summary report
7) Transactions processed per second
8)CPU And memory
(3) 500 Users log in at the same time
9) The successful running
10) Summary report
11) Transactions processed per second
12)CPU And memory
4.2 The reimbursement document is loaded 、 preservation
4.2.1 The scene that
The user logs into the system and enters the system , Separately and concurrently simulate 20、50、100 A user opens the reimbursement document and loads 、 Save the document , Duration is 15 minute , The monitoring index is response time , Transaction success rate , The server cpu And memory usage, etc .
4.2.2 The test case
The table below for 20、50、100 A user opens the reimbursement document and loads 、 Save the test case of the document :
| Use case name |
20、50、100 At the same time, open the general reimbursement document and load 、 preservation 、 Submit documents |
Use case number |
002 |
| testing procedure |
1、 User login system , 3、 Enter the content of the general reimbursement document , Click Save to save the general reimbursement document 4、 Click submit to submit the general reimbursement form |
||
| Scene design |
1、 Start every second 5 Virtual users , A total of generated *** Virtual users ; |
||
| Focus on business |
New document 、 Save the document 、 Submit documents |
||
| Monitoring indicators |
response time , Number of successful transactions , The server cpu, Memory usage |
||
| Expected results |
Response time is less than 5 second , The transaction success rate is greater than 99%,cpu The utilization rate is less than 75%, Memory usage is less than 75%. |
||
4.2.3 test result
| scene |
Number of concurrent users |
Duration of pressure measurement |
90% User response time (s) |
Mean response time (s) |
Transaction success rate |
Transactions processed per second |
The number of successful things |
The number of failed things |
Number of script run errors |
|
| Reimbursement |
newly build |
20 |
10min |
3.4 |
2.4 |
100% |
0.276 |
|||
| 50 |
10min |
30.3 |
9 |
100% |
0.554 |
|||||
| 100 |
15min |
18.7 |
9.8 |
99.4% |
0.521 |
|||||
| 150 |
15min |
|||||||||
| preservation |
20 |
10min |
1.6 |
1.2 |
100% |
0.276 |
||||
| 50 |
10min |
2.1 |
1.2 |
100% |
0.554 |
|||||
| 100 |
15min |
2.3 |
1.4 |
99.5% |
0.506 |
|||||
| 150 |
15min |
2.4 |
1.5 |
99.3% |
0.317 |
|||||
(1) 20 The user opens the reimbursement document at the same time and loads 、 Save the document
1) The successful running
2) Summary report
3) Transactions processed per second
4)CPU And memory
(2) 50 The user opens the reimbursement document at the same time and loads 、 Save the document
1) The successful running
2) Summary report
3) Transactions processed per second
4)CPU And memory
(3) 100 The user opens the reimbursement document at the same time and loads 、 Save the document
5) The successful running
6) Summary report
7) Transactions processed per second
8)CPU And memory
(4) 150 The user opens the reimbursement document at the same time and loads 、 Save the document
9) The successful running
10) Summary report
11) Transactions processed per second
12)CPU And memory
4.3 Submit the reimbursement form
4.3.1 The scene that
The user logs into the system and enters the system , Separately and concurrently simulate 20、50、100 One user opens the reimbursement document and submits the document , Duration is 15 minute , The monitoring index is response time , Transaction success rate , The server cpu And memory usage, etc .
4.3.2 The test case
The table below for 50、150 A test case in which a user opens a reimbursement document and submits a document :
| Use case name |
50、150 The applicant opens the reimbursement form and submits the document at the same time |
Use case number |
002 |
| testing procedure |
1、 User login system , 3、 Enter the content of the reimbursement form , Click Save to save the reimbursement form 4、 Click submit to submit the general reimbursement form |
||
| Scene design |
1、 Start every second 5 Virtual users , A total of generated *** Virtual users ; |
||
| Focus on business |
Submit documents |
||
| Monitoring indicators |
response time , Number of successful transactions , The server cpu, Memory usage |
||
| Expected results |
Response time is less than 5 second , The transaction success rate is greater than 99%,cpu The utilization rate is less than 75%, Memory usage is less than 75%. |
||
4.3.3 test result
| scene |
Number of concurrent users |
Duration of pressure measurement |
90% User response time (s) |
Mean response time (s) |
Transaction success rate |
Transactions processed per second |
The number of successful things |
The number of failed things |
Stop the number of things |
|
| General reimbursement form |
Submit |
50 |
15min |
4.441 |
2.666 |
99.8% |
2.666 |
|||
| 150 |
15min |
4.5 |
3.4 |
99.5% |
0.137 |
|||||
| 15min |
||||||||||
(5) 50 You can open the reimbursement document and submit the document at the same time
5) The successful running
6) Summary report
7) Transactions processed per second
8)CPU And memory
(6) 150 You can open the reimbursement document and submit the document at the same time
13) The successful running
14) Summary report
15) Transactions processed per second
16)CPU And memory
版权声明
本文为[Goodbye, Monkey King_]所创,转载请带上原文链接,感谢
https://yzsam.com/2022/04/202204211152391334.html
边栏推荐
猜你喜欢

去中心化VC平台CULTDAO发起对BetaMars项目投票,目前投票正在进行中

Oracle provides superior database performance and scale through exadata cloud infrastructure x9m

hiredis和rapidjson库的使用小结
Usage Summary of hiredis and rapidjson Libraries

给定字符串提取姓名(字符串、list、re“零宽断言”)

Solution | fast intercom dispatching system: efficient cooperation

世界读书日|数据库经典书籍推荐书单(文末留言免费送)

天梯赛题目记录(二)

Massive data generated 421 million yuan of revenue in 2021, and the gross profit margin of database products increased by 8.78%!
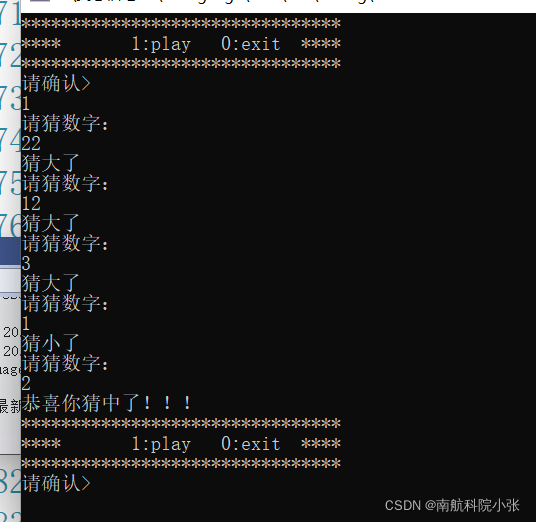
A small game of guessing numbers
随机推荐
国内期货开户去哪里开可以费率低,公司又安全?
Analyze the future development direction of GPU
华润怡宝被传IPO,农夫山泉或将迎来早年“宿敌”
Leaflet military plotting - Assault direction modification (leaflet chapter. 90)
【软件测试系列十二】《压力测试报告模板》
Scala安装和开发环境配置教程
Branch if statement
Oracle数据库机越极简越可靠,甲骨文11年前埋的“彩蛋”
云原生DaaS服务—分布式对象存储简述
Teach you to easily solve CSRF Cross Site Request Forgery Attack
分支 if语句
Chrome开发者工具详解 一
一个猜数字的小游戏
The basic software products of xinghuan science and technology have been fully implemented and blossomed, bringing "Star" momentum to the digital transformation of enterprises
教你轻松解决CSRF跨站请求伪造攻击
NoSuchBeanDefinitionException - not resolved currently
PHP 零基础入门笔记(11):字符串 String
Leetcode daily question: 824 Goat Latin
宏杉MOFS分布式存储系统斩获“2022分布式存储产品金奖”
php如何判断指定日期是不是前一天