当前位置:网站首页>Elk setup (IV): monitor MySQL slow query and error log
Elk setup (IV): monitor MySQL slow query and error log
2022-04-23 00:44:00 【wu55555】
This article has participated in 「 New people's creation ceremony 」 Activities , Start the road of nuggets creation together .
0. introduction
because mysql free 、 Stable and good performance , It is the database choice of most companies on the market . In the actual production environment, we need to know the error log in the database in time 、 Slow log and other information , To help us troubleshoot and optimize .
The common way to view logs on the server is not convenient , Especially when it comes to distributed deployment , Therefore, we need a unified monitoring platform for real-time monitoring 、 It is convenient to view these log data .
So let's build such a platform step by step today
2. download
First of all, it's about ELK The construction of the is no longer exhausting , Students who don't know can look at previous blogs : ELK build ( One ): Realize distributed micro service log monitoring
Because of my ELK The environment is 7.13.0 Of , So we need to download the corresponding version filebeat filebeat Official download address
3. filebeat Introduce
filebeat yes elastic An official lightweight log collector , According to the name, you can also know , It is mainly used for data collection of files . be based on Golang Development , It can be installed on the server or host where you want to log, and the corresponding data can be read regularly , And send it to elasticsearch perhaps logstash On , Even when there is a large amount of data , We can also output to kafka、redis Wait on the middleware .
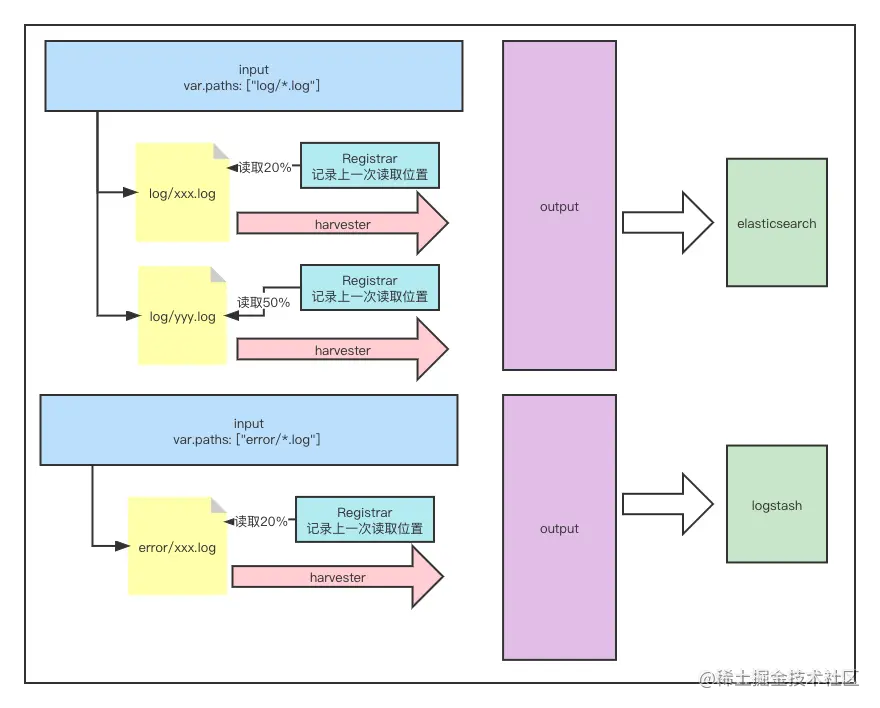
according to Official documents The explanation of ,filebeat It mainly contains two main components :input and harvesters.
- harvester: harvester Used to read the contents of a single file by line . Each file will launch a harvester,harvester Responsible for opening and closing files .filebeat One more Registrar Component is used to record the offset of the file , That is, the last read position , The next time you open a file, it will be from Registrar Read the offset and continue reading the data
- input: Responsible for managing the harvester And find all the files that meet the reading conditions . If the input type is log, be input The file that matches the defined path will be found on the drive , And will start a for each file harvester.
Secondly, configure Output The component outputs the obtained data .
filebeat Support data collection of multiple services in , Including but not limited to Mysql,MongoDB,Nginx,Redis,ActiveMQ,PostgreSQL,RabbitMQ,Tomcat wait . More to see Official documents
On collocation kibana Out of the box data Kanban provided , Can quickly build a monitoring platform .
4. install filebeat
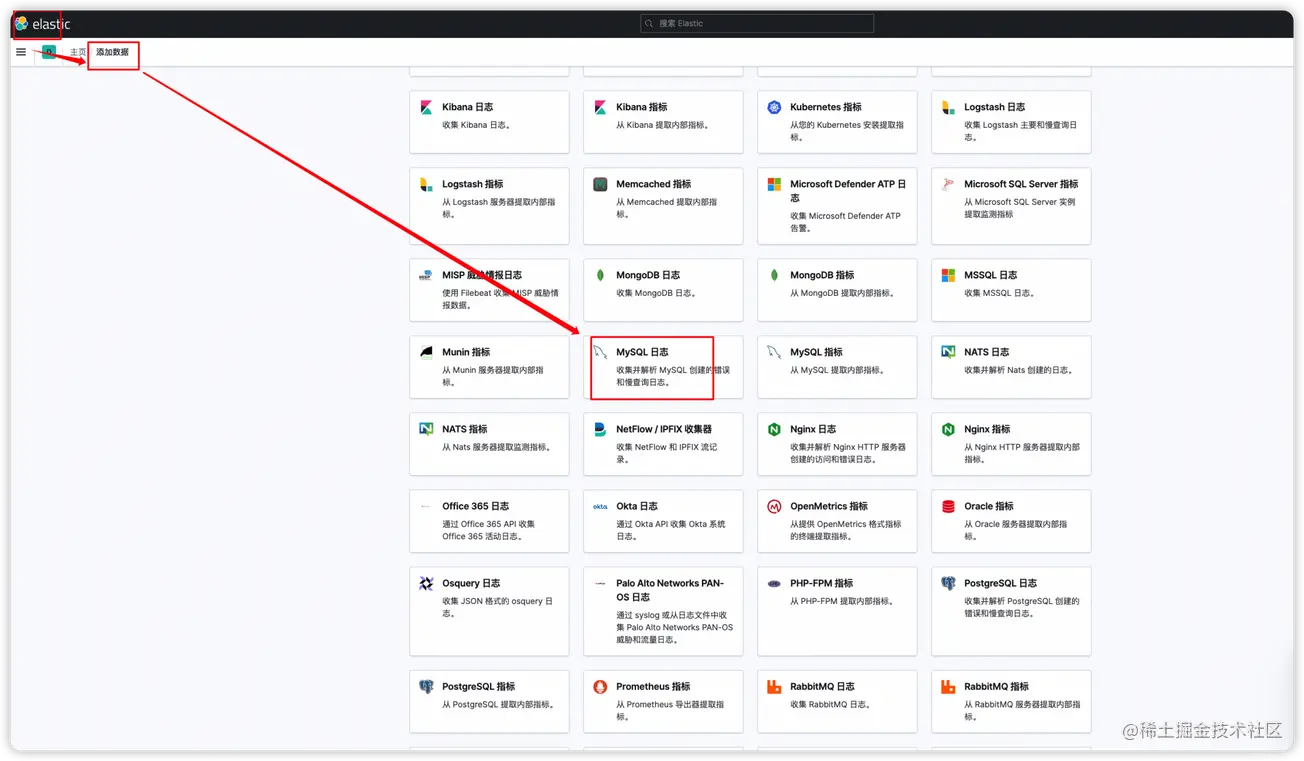
The following installation steps can also be found in kibana Home page > Add data >MySQL See in the log page

1、 Decompress the package ( Here we use mac Version example , During actual operation, please download the corresponding system and version as required filebeat)
tar -zxvf filebeat-7.13.0-darwin-x86_64.tar.gz
 Copy code
2、 modify filebeat.yml The configuration file
setup.template.settings:
  index.number_of_shards: 1
  #  because es It's a single node , So set replica sharding to 0. Otherwise, it will be yellow
  index.number_of_replicas: 0
output.elasticsearch:
  hosts: ["192.168.244.11:9200"]
  username: "elastic"
  password: "elastic"
setup.kibana:
  host: "192.168.244.11:5601"
 Copy code
3、 Enable mysql modular
./filebeat modules enable mysql
 Copy code
4、 modify mysql module The configuration file
vim modules.d mysql.yml
 Copy code
Modify the content , The default configuration is directly adopted here , That is, collect error logs and slow logs
- module: mysql
# Error logs
error:
enabled: true
# Log path , If you don't configure ,filebeat The log path will be selected according to the operating system .
var.paths: ["/opt/homebrew/var/mysql/MacBook-Pro.local.err*"]
# Slow logs
slowlog:
enabled: true
# Log path , If you don't configure ,filebeat The log path will be selected according to the operating system .
var.paths: ["/opt/homebrew/var/mysql/MacBook-Pro-slow.log*"]
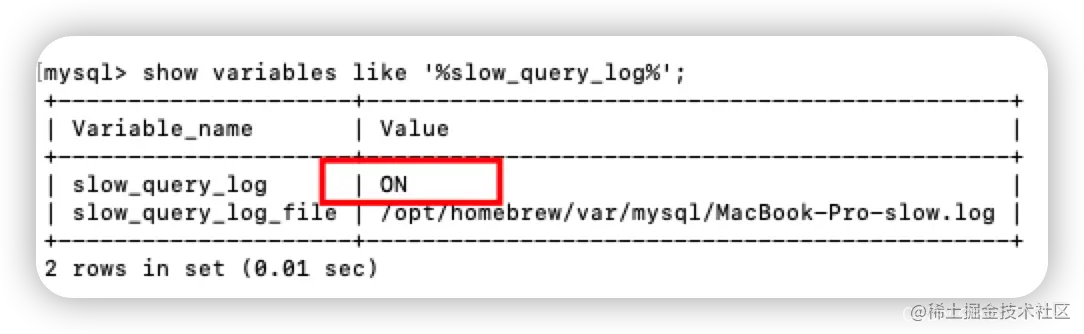
Copy code If you don't know the location of the error log and slow log , You can query through the following two instructions
 show variables like 'log_error';
 show variables like '%slow_query_log%';
 Copy code
5、 load kibana The dashboard
./filebeat setup
 Copy code
6、 function filebeat, Note that the above instructions should not be interrupted before execution , Directly open a new window to execute , Otherwise, panel generation may fail
./filebeat -e
Copy code 

GET filebeat-7.13.0/_search
Copy code 


test
1、 stay mysql Execute the following instructions in , Because the threshold is set to 3, So set up sleep 5s Will be judged as slow query
select sleep(5);
Copy code 
2、 View panel , You can see that the slow log has been updated 
5. mysql Open slow log
If mysql There is no slow log , To turn on :
1、 land mysql, see mysql Whether to turn on slow log
show variables like '%slow_query_log%';
 Copy code
As shown in the figure, it is not open 
sudo vim /etc/my.cnf
 Copy code
Add content
[mysqld]
#  Open slow log
slow_query_log=1
#  Log location
slow_query_log_file=/opt/homebrew/var/mysql/MacBook-Pro-slow.log
#  Set the threshold
long_query_time=3
#  Output form
log_output=FILE
 Copy code
3、 restart mysql
sudo mysql.server restart
 Copy code
4、 Log in again to check , Already open
Official account Elasticsearch The home of , Learn more about what's new
Refer to the post
版权声明
本文为[wu55555]所创,转载请带上原文链接,感谢
https:https://yzsam.com/html/KeMqgZ.html
边栏推荐
猜你喜欢
![[image classification] understand Alex net](/img/a5/fb134430ae18fcc85c6746f5750b1d.jpg)
[image classification] understand Alex net

C语言 #和 ##

Shenkaihong News Studio opened for the first time to witness the whole process of the growth of the times

MySQL -- operation of database

SynchronousQueue 源码解析

io_ Application of ring technology in distributed cloud native database
The addition inverse element (a ^ a = 0) XOR operation, which has no performance advantage, is just an intelligence game

C WPF UI framework mahapps switching theme

在Google工作的十年,也是我开心的十年

Enterprises choose to privatize the deployment of IM instant messaging software to fully protect information security!
随机推荐
396. Rotation function / Sword finger offer II 013 Sum of two-dimensional submatrix
April 22, 2022, day 15
Deep learning basic learning - residual
多测师杭州拱墅校区肖sir_高级金牌讲师_简历制作讲解
jsp 转换为thymeleaf格式的部分方式
市场格局进入重构期,ESP频繁「召回」,中国供应商「乘势而上」
申请CA证书的步骤
This new feature of C 11, I would like to call it the strongest!
[image classification] understand Alex net
leetcode 134. 加油站
L3-1 直捣黄龙 (30 分) djk+dfs
Alternative scheme of 24V ~ 48V magnetic absorption track lamp fs2459 to mp2459
[C#]给地球点颜色看看
关于软考,这些常见问题一定要明白
移动端京东商城
MP2459被完美替代内部集成有功率MOSFET管FS2459的60V0.5A降压IC
Snap installation repo problem
MySQL -- data type
多测师杭州拱墅校区肖sir_高级金牌讲师_简历实战
Kotlin - inherit open