当前位置:网站首页>Oracle性能分析工具:OSWatcher
Oracle性能分析工具:OSWatcher
2022-04-23 05:59:00 【Sebastien23】
Oracle性能分析工具:OSWatcher
OSWatcher Black Box, 简称 OSW,是Oracle提供的一个小但是非常有用的工具,它通过调用OS自己提供的命令来记录OS运行时的一些性能参数,比如CPU/Memory/Swap/Network IO/Disk IO相关的信息。
为什么要使用OSWatcher
OSW并不是强制要部署的,并且有很多工具可以提供一样的功能,比如说:mrtg, cacti, sar, nmon, enterprise manger grid control。
但是部署OSW有很多好处:
- 它比较容易部署,并且容易删除;
- 资源消耗比较小,不管是从CPU,内存还是磁盘空间来说;
- 平时不需要维护,并且在发生问题时可以帮我们迅速定位问题是否发生在OS端。
数据库是运行在OS之上的,如果OS发生了异常,那么数据库肯定也会受到影响;如果我们仅仅从数据库的角度去分析这样的问题时,很难有个好结果。
在平时的工作中,有一类问题很常见:在过去的某个时间段,数据库发生了一些问题,我们往往要找到问题的根本原因,之后才能做某些改动来避免它再次发生。对于这样的问题,OSW是非常有用的,举几个小例子:
- 发生的问题并不是由于OS的异常引起的。这时候如果我们有在发生问题的时候收集的OSW数据,我们就可以立刻排除OS方面,把注意力投向DB/应用层。
- 对于ORACLE Database Performance的问题,我们往往第一个方向就是排除OS的问题。
比如OS在某个时间段发生了很频繁的Swapping,那么内存相关的操作就会受到影响,数据库性能也会下降,表现在AWR中就会发现数据库有latch/mutex相关的等待。 - 应用在某个时间段响应非常慢。AWR显示数据库非常的空闲,top5等待事件也都是很正常;从CPU,内存,Swap, Disk IO方面看也都很正常。后来发现OSW中关于网络的数据显示,发生问题时有非常多的丢包现象。如果当时没有收集到OSW的数据,那么基本上是不可能找到原因了。
- 又比如某些ORA-04030的错误或者CJQ0, P00X, J00X进程不能启动的问题,如果我们部署了OSW,那么我们就能立刻知道这些错误是不是由于OS的内存短缺引起的。
- 如果某个server process莫名hung住,我们可以通过OSW的信息来看当时这个进程是不是出于suspend的状态,是不是占用了太多的CPU/Memory。
- 某些Listener hung的问题,我们也需要OSW的历史信息来进行下一步的分析。
- Login Storm问题:客户的数据库系统突然变慢,从应用端,数据库的ASH,AWR报告中没有发现任何异常。但是通过OSW的ps的输出发现,在发生问题时, oracle 的server process比平时多了上千个。
实际上,OSW对于我们分析问题是非常有帮助的。如果当前OS上并没有部署任何的监控软件,那么强烈建议DBA来部署OSW。很多重要的生产环境都部署了OSW,在有关于DB Performance的问题时,他们往往会先提交OSW的输出。
大家对部署OSW的顾虑往往是:
- 生产环境已经正常运行了很久了,基于稳妥的考虑,不能随便安装软件;
- OSW会不会带来副作用。
OSW的工作机制是每隔一段时间调用OS提供的一些工具,比如ps, vmstat, netstat, mpstat, top;然后把这些工具的输出打印到文件里。 它不可避免的会消耗CPU, Disk IO, Disk Space, Memory;但是这些消耗的资源都是非常少的,在大部分的系统里都是可以忽略的。只有在某些极端情况下,部署OSW才会带来负面影响:系统已经是非常的忙,CPU使用率在90%以上;磁盘的free space已经没有了。所以大家的顾虑在大部分的情况下都是不必要的,部署OSW是没有什么风险的。
OSWatcher的安装部署
下面讲一下如何在UNIX/LINUX上安装/部署OSW。首先从文档301137.1上下载OSW。
安装OSW
随便找一个目录解压安装,不要在 /tmp 目录,不必须root用户。
[oracle@rhel6 ~]$ mkdir oswatcher
[oracle@rhel6 ~]$ mv oswbb734.tar oswatcher/
[oracle@rhel6 ~]$ cd oswatcher/
[oracle@rhel6 oswatcher]$ ls
oswbb734.tar
[oracle@rhel6 oswatcher]$ tar -xvf oswbb734.tar
oswbb/
oswbb/call_uptime.sh
oswbb/profile/
oswbb/analysis/
oswbb/tar_up_partial_archive.sh
oswbb/oswsub.sh
oswbb/oswrds.sh
oswbb/src/
oswbb/src/missing_graphic.gif
oswbb/src/tombody.gif
oswbb/src/coe_logo.gif
oswbb/src/Thumbs.db
oswbb/src/OSW_profile.htm
oswbb/src/oswbba_input.txt
oswbb/src/watch.gif
oswbb/oswib.sh
oswbb/call_du.sh
oswbb/tarupfiles.sh
oswbb/ltop.sh
oswbb/nfssub.sh
oswbb/docs/
oswbb/docs/OSWatcher/
oswbb/docs/OSWatcher/OSWatcherUserGuide.pdf
oswbb/docs/OSWatcher/oswbb_README.txt
oswbb/docs/The_Analyzer/
oswbb/docs/The_Analyzer/oswbba_README.txt
oswbb/docs/The_Analyzer/oswbbaUserGuide.pdf
oswbb/docs/The_Analyzer/OSWatcherAnalyzerOverview.pdf
oswbb/OSWatcher.sh
oswbb/psmemsub.sh
oswbb/call_sar.sh
oswbb/oswnet.sh
oswbb/Exampleprivate.net
oswbb/mpsub.sh
oswbb/Example_extras.txt
oswbb/OSWatcherFM.sh
oswbb/startOSWbb.sh
oswbb/ifconfigsub.sh
oswbb/iosub.sh
oswbb/oswbba.jar
oswbb/vmsub.sh
oswbb/xtop.sh
oswbb/stopOSWbb.sh
OSWatcher包含两部分:
- oswbb:这是一个Unix的 shell script脚本集合,其用来收集和归档数据,从而帮助定位问题;
- oswbba:这是一个java工具用于分析收集到的数据并提供建议,还可以生成图片或html文档。
启动OSW
startOSWbb.sh脚本有四个参数:
- ARG1 = snapshot interval in seconds. 指定多少秒采集一次数据。
- ARG2 = the number of hours of archive data to store. 指定采集的数据文件在归档路径保留多少个小时。
- ARG3 = (optional) the name of a compress utility to compress each file automatically after it is created. 可选参数,打包压缩工具,在完成收集后OSW 将使用其来打包压缩归档文件。
- ARG4 = (optional) an alternate (non default) location to store the archive directory. 可选参数,指定采集归档数据的输出目录,默认为系统变量
OSWBB_ARCHIVE_DEST的值。
如果不输入任何参数,默认间隔30秒收集一次数据,并且默认保存48小时的数据。默认收集到的数据会存储在解压目录下的 archive 目录下,这个目录是在第一次启动startOSWbb.sh脚本时创建的。
#启动startOSWbb.sh脚本,间隔15秒,保存5天的数据
[oracle@rhel6 oswbb]$ nohup sh startOSWbb.sh 15 120 &
[1] 3131
[oracle@rhel6 oswbb]$ nohup: ignoring input and appending output to `nohup.out'

[1]+  Done                    nohup sh startOSWbb.sh 15 120

#查看输出日志
[oracle@rhel6 oswbb]$ more nohup.out
Setting the archive log directory to/home/oracle/oswatcher/oswbb/archive

Testing for discovery of OS Utilities...
VMSTAT found on your system.
IOSTAT found on your system.
MPSTAT found on your system.
IFCONFIG found on your system.
NETSTAT found on your system.
TOP found on your system.

Testing for discovery of OS CPU COUNT
oswbb is looking for the CPU COUNT on your system
CPU COUNT will be used by oswbba to automatically look for cpu problems

CPU COUNT found on your system.
CPU COUNT = 2

Discovery completed.

#生成的archive目录下生成了对应不同收集信息的目录
[oracle@rhel6 oswbb]$ cd archive
[oracle@rhel6 archive]$ ls
oswifconfig  oswiostat  oswmeminfo  oswmpstat  oswnetstat
oswprvtnet  oswps  oswslabinfo  oswtop  oswvmstat
MOS文档 ID 1531223.1有详细的介绍各个目录的含义。
如果想自动压缩生成的文件,请使用下面的命令来启动OSWatcher:
$ nohup ./startOSWbb.sh 15 120 gzip &
关闭和卸载OSW
卸载OSWatche也是非常简单。
卸载前先停止OSWatcher:
$ ./stopOSWbb.sh
删除OSWatcher的目录oswbb:
$ rm -rf oswbb
OSWatcher在系统重启过后,是无法自动重启的,如果需要设置OSWatcher开机自启动,需要安装、配置 osw-service 这个RPM包。这个安装包可以从 How To Start OSWatcher Black Box (OSWBB) Every System Boot Using RPM oswbb-service (文档 ID 580513.1)下载。
OSW归档目录结构
OSWatcher采集的数据都存放在 archive 目录路径下,下面会生成 oswiostat、oswmeminfo、oswmpstat等10个目录。
[oracle@DB-Server archive]$ tree

|-- oswifconfig
|-- oswiostat
|   |-- DB-Server.localdomain_iostat_16.12.09.1300.dat
|   |-- DB-Server.localdomain_iostat_16.12.09.1400.dat
|-- oswmeminfo
|   |-- DB-Server.localdomain_meminfo_16.12.09.1300.dat
|   |-- DB-Server.localdomain_meminfo_16.12.09.1400.dat
|-- oswmpstat
|   |-- DB-Server.localdomain_mpstat_16.12.09.1300.dat
|   |-- DB-Server.localdomain_mpstat_16.12.09.1400.dat
|-- oswnetstat
|   |-- DB-Server.localdomain_netstat_16.12.09.1300.dat
|   |-- DB-Server.localdomain_netstat_16.12.09.1400.dat
|-- oswprvtnet
|-- oswps
|   |-- DB-Server.localdomain_ps_16.12.09.1300.dat
|   |-- DB-Server.localdomain_ps_16.12.09.1400.dat
|-- oswslabinfo
|   |-- DB-Server.localdomain_slabinfo_16.12.09.1300.dat
|   |-- DB-Server.localdomain_slabinfo_16.12.09.1400.dat
|-- oswtop
|   |-- DB-Server.localdomain_top_16.12.09.1300.dat
|   |-- DB-Server.localdomain_top_16.12.09.1400.dat
`-- oswvmstat
    |-- DB-Server.localdomain_vmstat_16.12.09.1300.dat
    |-- DB-Server.localdomain_vmstat_16.12.09.1400.dat
采集的数据文件命名格式为OSWatcher 输出文件格式为:<节点名>_<操作系统工具名>_YY.MM.DD.HH24.dat。
下面介绍其中几个归档目录中采集到的性能参数。
#1 oswiostat
- r/s: shows the number of reads per second.
- w/s: shows the number of writes per second.
- kr/s: shows the number of kilobytes read per second.
- kw/s: shows the number of kilobytes written per second.
- wait: average number of transactions waiting for service (queue length).
- actv: average number of transactions actively being serviced.
- wsvc_t: average service time in wait queue, in milliseconds.
- asvc_t: average service time of active transactions, in milliseconds.
- %w: percent of time there are transactions waiting for service.
- %b: percent of time the disk is busy.
- device: device name.
#2 oswmpstat
- cpu: processor ID.
- minf: minor faults.
- mif: major faults.
- xcal: processor cross-calls (when one CPU wakes up another by interrupting it).
- intr: interrupts.
- icsw: involuntary context switches.
- migr: thread migrations to another processor.
- smtx: number of times a CPU failed to obtain a mutex.
- srw: number of times a CPU failed to obtain a read/write lock on the first try.
- usr: percentage of CPU cycles spent on user processes.
- sys: percentage of CPU cycles spent on system processes.
- wt: percentage of CPU cycles spent waiting on event.
- idl: percentage of unused CPU cycles or idle time when the CPU is basically doing nothing.
#3 oswnetstat
- name: device name of interface.
- Mtu: maximum transmission unit.
- Net: network segment address.
- address: network address of the device.
- ipkts: input packets.
- lerrs: input errors.
- queue: nummber in the queue.
使用oswbba生成报告
OSWatcher bba 是一个Java语言写的应用程序,需要安装 Java 1.4.2 或更高的版本。oswbba能够在任何有X Windows的Unix平台或Windows平台上运行,X Windows环境是必须的,因为oswbba需要用到 Oracle Chartbuilder 组件,而这个组件需要它。
[oracle@rhel6 oswbb]$ java -version

java version "1.8.0_111"
Java(TM) SE Runtime Environment (build 1.8.0_111-b14)
Java HotSpot(TM) 64-Bit Server VM (build 25.111-b14, mixed mode)

[oracle@rhel6 oswbb]$ export DISPLAY=:0.0
#1 生成图形
执行以下命令来生成oswbba分析图形。图形生成过程中会提示一些可选参数,根据需要选择。
[oracle@rhel6 oswbb]$ java -jar oswbba.jar -i /home/oracle/monitoring/oswbb/archive/
#或
[oracle@rhel6 oswbb]$ java -jar -Xmx512M oswbba.jar -i /home/oracle/monitoring/oswbb/archive/
# 生成特定时间段的图形
[oracle@rhel6 oswbb]$ java -jar -Xmx256m oswbba.jar -i /home/oracle/scripts/oswbb/archive
-B Dec 7 15:30:00 2016 -E Dec 7 17:00:00 2016
#2 生成报告
oswbba也能生成非常详细的文本格式的分析报告。
[oracle@rhel6 oswbb]$ java -jar oswbba.jar -i /home/oracle/monitoring/oswbb/archive/ -A
生成的报告在 oswbb/analysis/ 目录下。
其实使用OSWatcher的使用并没有什么难度,反而是要理解报表或分析报告中的指标意义,能够结合AWR、ASH以及其他数据库诊断信息来分析、诊断问题。这个才是有难度的。关于具体指标的详细说明,OSWatcher Analyzer User Guide (文档 ID 461053.1) 中已有详细解说。
OSW常见错误处理
#1 如何判断OSWatcher是否正在运行
判断OSWatcher是否正在运行,非常简单,使用ps命令查看是否存在OSWatcher的相关进程即可。
$ ps -ef | grep -i OSWatcher
#2 没有设置JAVA环境变量,生成图形或报表时会遇到下面错误:
ERROR. You do not have a legitimate version of java in your PATH.
设置JAVA环境变量后,然后执行oswbba命令即可。
$ export PATH=$ORACLE_HOME/jre/1.4.2/bin:$PATH
#3 运行 java -jar oswbba.jar ... 时报错 Exception in thread "main" java.lang.OutOfMemoryError
这个是因为JAVA的堆栈设置太小的缘故,加载到内存中的数据量过于庞大,需要设置参数 -Xmx。可以用 -Xmx256m 或 -Xmx512m。
$ java -jar -Xmx256m oswbba.jar -i /home/oracle/scripts/oswbb/archive
oswbba parses all the archive files in memory prior to generating graphs or performing an analysis. If you have a large amount of files to parse you may need to allocate more memory in the java heap. If you experience any error messages regarding out of memory such as java.lang.OutOfMemoryError, you may have to increase the size of the java heap. To increase the size of the java heap use the -Xmx flag.
#4 oswbba是否可以在命令行界面生成html报告文件
可以,但是会遇到很多杂七杂八的问题。比如:
No X11 DISPLAY variable was set, but this program performed an operation which requires it.
如果是root账号,只要执行 export DISPLAY=:0.0 命令后,即可在SecureCRT或 命令窗口生成报表文件。
如果是oracle用户,还是有可能还会遇到下面问题:
Exception in the thread “main” java.awt.AWTError: Can’t connect to X11 window server using ‘:0.0’ as the value of the …。
此时需要切换到root账号,执行下面命令,然后切换到oracle用户下执行命令
[oracle@rhel6 oswbb]$ su - root
[oracle@rhel6 oswbb]$ export DISPLAY=:0.0
[oracle@rhel6 oswbb]$ xhost local:oracle
non-network local connections being added to access control list
在SecureCRT中,你不能选择1-5这几个选项,否则依然会遇到 Can't connect to X11 window server using ':0.0' 这个错误。这个只能在图形化界面才能执行。例如通过VNC来生成。
References:
[1] https://blogs.oracle.com/database4cn/osw-oswatcher-black-box
[2] https://www.linuxidc.com/Linux/2016-12/138680.htm
[3] http://blog.sina.com.cn/s/blog_61cd89f60102ed4e.html
[4] https://www.cnblogs.com/kerrycode/archive/2016/12/22/6210650.html
版权声明
本文为[Sebastien23]所创,转载请带上原文链接,感谢
https://blog.csdn.net/Sebastien23/article/details/118544887
边栏推荐
猜你喜欢


随机推荐
柯里化实现函数连续调用计算累加和
Leak detection and vacancy filling (IX) -- Procedure
浏览器工作原理与实践
百度地图案例-修改地图样式
ebfp编程常用API介绍
input文件上传
1-5 NodeJS CommonJs规范
修改Jupyter Notebook样式
Sum (if) in MySQL_ Sum (if ()) in MySQL
memcached 源码分析
PHP unlimited classification and tree
百度地图案例-缩放组件、地图比例组件
Centos8 builds php8 0.3 operating environment
file_get_contents 访问 ssl 错误的两种解决方法
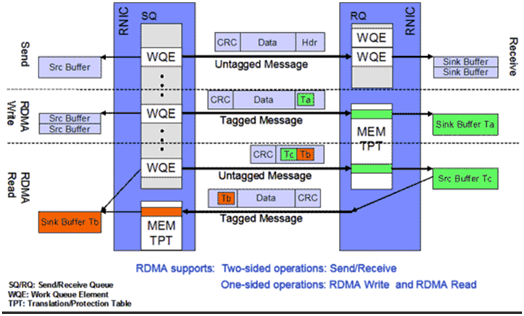
rdma 介绍
【代码解析(4)】Communication-Efficient Learning of Deep Networks from Decentralized Data
SQL学习|集合运算
TP5 uses redis
TypeScript(上)
ovs与ovs+dpdk架构分析