当前位置:网站首页>matplotlib散点图自定义坐标轴(文字坐标轴)
matplotlib散点图自定义坐标轴(文字坐标轴)
2022-08-09 22:10:00 【奋斗中的打工人】
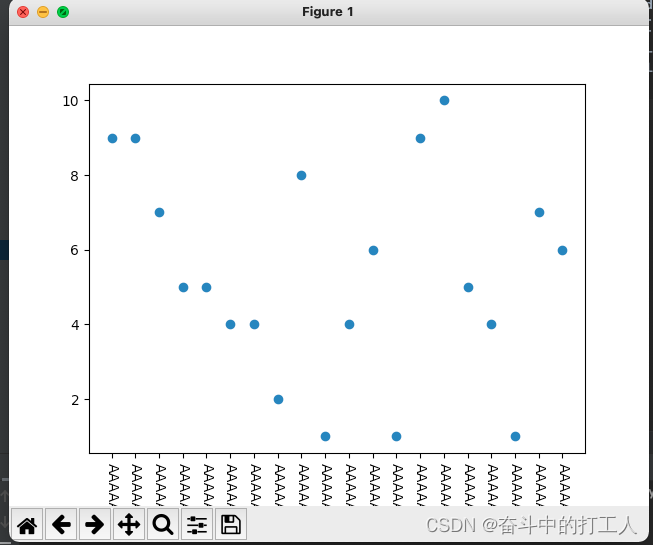
效果
代码
import matplotlib.pyplot as plt
import random

x_list = [i for i in range(20)]  # 生成X坐标
y_list = [random.randint(1, 10) for i in range(20)]  # 生成y坐标
label_list = ["AAAAAA" for i in range(20)]  # 生成标签
plt.scatter(x_list, y_list)  # 绘制散点图
plt.xticks(x_list, label_list, rotation=270)  # 设置标签,并且旋转270度
plt.show()
边栏推荐
- Interfering with BGP routing---community attributes
- Qt 消息机制和事件
- Bi Sheng Compiler Optimization: Lazy Code Motion
- 毕昇编译器优化:Lazy Code Motion
- LeetCode_2632_字符串压缩
- ArrayList 和 LinkedList 区别
- 【LaTex】 Font “FandolSong-Regular“ does not contain requested(fontspec)Script “CJK“.如何抑制此种警告?
- JS--hashchange事件--使用/教程
- Leetcode 701. 二叉搜索树中的插入操作
- VR全景拍摄如何拍摄?如何使用拍摄器材?
猜你喜欢
leetcode:331. 验证二叉树的前序序列化
一体化伺服电机在三轴钻孔机中的应用

少儿编程 电子学会图形化编程等级考试Scratch三级真题解析(判断题)2022年6月

Swift 需求 如何防止把view重复添加到win里面

毕昇编译器优化:Lazy Code Motion
Vmware中安装win7虚拟机以及相关简单知识

&& 不是此版本的有效语句分隔符

数字与中文大写数字互转(5千万亿亿亿亿以上的数字也支持转换)
leetcode brush questions diary Calculate the number of elements on the right that is less than the current element

【实用工具系列】MathCAD入门安装及快速上手使用教程
随机推荐
kubesphere
APS系统能消除造成生产和运输延迟的瓶颈
R语言ggstatsplot包grouped_ggscatterstats函数可视化分组散点图、并添加假设检验结果(包含样本数、统计量、效应大小及其置信区间、显著性、组间两两比较、贝叶斯假设)
新增一地公布2022下半年软考报考时间
异常处理(try,catch,finally)
继承关系下构造方法的访问特点
一体化伺服电机在三轴钻孔机中的应用
R语言patchwork包将多个可视化结果组合起来、使用plot_annotation函数以及tag_level参数将组合图用大写字母进行顺序编码、为组合图的标签添加自定义前缀信息
少儿编程 电子学会图形化编程等级考试Scratch三级真题解析(判断题)2022年6月
Leetcode.25 K个一组翻转链表(模拟/递归)
【技术分享】SLA(服务等级协议)原理与配置
迁移学习 & 凯明初始化
OSS文件上传
Socket发送缓冲区接收缓冲区快问快答
leetcode:321. 拼接最大数
iNFTnews | 迪士尼如何布局Web3
安踏携手华为运动健康共同验证冠军跑鞋 创新引领中国体育
R语言ggplot2可视化:使用ggpubr包的ggerrorplot函数可视化误差线(可视化不同水平均值点以及se标准误差)、设置add参数为dotplot添加点阵图
【Apifox】为什么如此受青睐,此篇文章和大家分享
HUAWEI CLOUD escorts the whole process of "Wandering Ark" for the first time, creating a popular brand