当前位置:网站首页>Matlab handle graphics
Matlab handle graphics
2022-04-21 20:47:00 【qq_ forty-one million nine hundred and fifty-five thousand two 】
Handle graph is the general name of the underlying graph function set , It actually does the work of generating graphics . It can be used to control the appearance of an image or picture .
1 Object handle
Each image has a unique name , Call handle ( Is an integer or real number ).
Create handle Hnd1:
% Data preparation
x=-pi:0.1:pi;
y=sin(x);
% Create a curve
Hnd1=plot(x,y, 'LineWidth', 2)
1.1 Detect the properties of any object
value = get(handle, 'PropertyName');
value = get(handle);
Return the property name of this object , The domain value is the attribute value .
for example Hnd1 Properties of :get(Hnd1)
>> get(Hnd1)

Hnd1 =

  Line -  attribute :

              Color: [0 0.4470 0.7410]
          LineStyle: '-'
          LineWidth: 2
             Marker: 'none'
         MarkerSize: 6
    MarkerFaceColor: 'none'
              XData: [1×63 double]
              YData: [1×63 double]
              ZData: [1×0 double]

   Show   All attributes

    AlignVertexCenters: 'off'
            Annotation: [1×1 matlab.graphics.eventdata.Annotation]
          BeingDeleted: 'off'
            BusyAction: 'queue'
         ButtonDownFcn: ''
              Children: [0×0 GraphicsPlaceholder]
              Clipping: 'on'
                 Color: [0 0.4470 0.7410]
             CreateFcn: ''
             DeleteFcn: ''
           DisplayName: ''
      HandleVisibility: 'on'
               HitTest: 'on'
         Interruptible: 'on'
              LineJoin: 'round'
             LineStyle: '-'
             LineWidth: 2
                Marker: 'none'
       MarkerEdgeColor: 'auto'
       MarkerFaceColor: 'none'
         MarkerIndices: [1×63 uint64]
            MarkerSize: 6
                Parent: [1×1 Axes]
         PickableParts: 'visible'
              Selected: 'off'
    SelectionHighlight: 'on'
                   Tag: ''
                  Type: 'line'
         UIContextMenu: [0×0 GraphicsPlaceholder]
              UserData: []
               Visible: 'on'
                 XData: [1×63 double]
             XDataMode: 'manual'
           XDataSource: ''
                 YData: [1×63 double]
           YDataSource: ''
                 ZData: [1×0 double]
           ZDataSource: ''
1.2 Setting object properties
set(handle,'PropertyName1', value1, ...); For example setting Hnd1 Properties of :
%set Function to modify properties
set(Hnd1,'LineWidth',4,'LineStyle','--');
1.3 Start the Attribute Editor
propedit(Hnd1);
propedit;
result :

1.4 use set Function lists possible attribute values
The function is used to provide a list of all possible attribute values .
for example :
% adopt set Function lists possible attribute values
set(Hnd1,'LineStyle')
result :
 5×1 cell  Array

    {'-'   }
    {'--'  }
    {':'   }
    {'-.'  }
    {'none'}
1.5 Custom data
In addition to a GUI Beyond the standard attributes defined by the object , The program can define special properties of the data to be controlled . Programmers can use additional attributes to add any type of data to GUI In the object . Any amount of data can be stored , And used for various purposes .
(1) Custom data :setappdata
setappdata(Hndl, 'DataName', DataValue); "DateName" Is the name of this data ;
”DateValue“ Is the value given to the name , It could be a number , It could be a string ;
for example :
 % Custom data ,DataValue Data values can be numbers , It could be a string
setappdata(Hnd1,'plot_name','plot(sinex)')
(2) Retrieve user-defined data getappdata
value = getappdata(Hndl, 'DataName');
struct = getappdata(Hndl);
"DateName" Is the name of the data to be called
for example :
 % Call custom data , return 'plot(sinex)'
value_set=getappdata(Hnd1,'plot_name')
struct=getappdata(Hnd1)
result :
value_set =

    'plot(sinex)'


struct =

   That contains the following fields  struct:

    ScribeProxyValue: 7.3863e+05
           plot_name: 'plot(sinex)'
Custom data correlation function :

2 Object search
If you plan to modify the properties of the object you create , Then please save the handle of the object , Calling function for base note get and set To prepare for .
But if you lose the handle for some reason , Sure i Retrieve by function :
- gcf Returns the handle of the current image , If this image does not exist ,gcf Will create a
- gca Returns the handle of the current coordinate system in the current image , If the image does not exist , Or there is no coordinate system in the current image
- gco Returns a handle to the current object
- findobj Find the graphic object with the specified attribute value , Limiting the number of search objects can speed up the operation of the function
form :
H_obj = gco;
type = get(H_obj, 'Type')
Hndls = findobj('PropertyName1',value1, ...)
give an example :
% For some reason , The handle to the object is missing , You can find by function
% Gets the handle of the current image . If this image does not exist ,gcf  Will create a
Hnd1_gcf=gcf
% Returns the handle of the current coordinate system in the current image , If the image does not exist , Or there is no coordinate system in the current image ,
% So the function  gca  A coordinate system is created , And return its handle
Hnd1_gca=gca
% Returns the handle of the current object in the current image
Hnd1_gco=gco
% Find the attribute that contains the specified attribute , Object with specified value . You can specify multiple properties / value ,findobj  Returns only the object handle that matches it .
H_fig = findobj('Type', 'figure')
result :
>> Hnd

Hnd1 =

  Line -  attribute :

              Color: [0 0.4470 0.7410]
          LineStyle: '-'
          LineWidth: 2
             Marker: 'none'
         MarkerSize: 6
    MarkerFaceColor: 'none'
              XData: [1×63 double]
              YData: [1×63 double]
              ZData: [1×0 double]
Hnd1_gcf =

  Figure (1) -  attribute :

      Number: 1
        Name: ''
       Color: [0.9400 0.9400 0.9400]
    Position: [680 678 560 420]
       Units: 'pixels'

   Show   All attributes


Hnd1_gca =

  Axes -  attribute :

             XLim: [-4 4]
             YLim: [-1 1]
           XScale: 'linear'
           YScale: 'linear'
    GridLineStyle: '-'
         Position: [0.1300 0.1100 0.7750 0.8150]
            Units: 'normalized'

   Show   All attributes


Hnd1_gco =

  Line -  attribute :

              Color: [0 0.4470 0.7410]
          LineStyle: '--'
          LineWidth: 4
             Marker: 'none'
         MarkerSize: 6
    MarkerFaceColor: 'none'
              XData: [1×63 double]
              YData: [1×63 double]
              ZData: [1×0 double]

   Show   All attributes


H_fig =

  Figure (1) -  attribute :

      Number: 1
        Name: ''
       Color: [0.9400 0.9400 0.9400]
    Position: [680 678 560 420]
       Units: 'pixels'

   Show   All attributes
3 Location and unit
All objects contain locations ”Position“ attribute , Used to specify the location and size of objects on the computer screen .
Position return vector [left bottom width height]
% Get location and units
position=get(gcf,'Position')
units=get(gcf,'Units')
result :
position =

   680   678   560   420


units =

    'pixels'
explain :
The distance between the lower left corner of the current image window and the right side of the screen is 680pixel, The distance from the bottom of the screen is 678pixel. The width of the image is 560pixel, The upper and lower height is 420pixel. Note that this is the diagrammable area of the image , Include boundary , Scroll bar , menu , And the title area of the image .
Company ("units") The default value of the property is pixels (pixels); Its attribute value can also be feet (inches), A centimeter (centimeters), spot (points), Or normalized coordinates (normalixed coordinates); The minimum resolution of a typical computer screen is 640×480; The normalized coordinates are 0 To 1 Within the scope of . In normalized coordinates , The bottom left corner of the screen is [0,0] The upper right corner is [1.0, 1.0];
Normalized is usually used normalized coordinate , Regardless of the size of the monitor :
H = figure(1)
set(H,'units', 'normalized','position',[0.2 ,0.2 ,0.2, 0.1])
Example :
% Data preparation
x=-pi:0.1:pi;
y=sin(x);
% Create a curve
Hnd1=plot(x,y, 'LineWidth', 2)

H = figure(1)
set(H,'units', 'normalized','position',[0.2 ,0.2 ,0.2, 0.1])

%get Detect the properties of any object
get(Hnd1)
%set Function to modify properties
set(Hnd1,'LineWidth',4,'LineStyle','--');
% Open Attribute Editor
propedit(Hnd1);
% adopt set Function lists possible attribute values
set(Hnd1,'LineStyle')
%  result :
%     {'-'   }
%     {'--'  }
%     {':'   }
%     {'-.'  }
%     {'none'}

% All possible values of all properties of the object
set(Hnd1)

 % Custom data ,DataValue Data values can be numbers , It could be a string
setappdata(Hnd1,'plot_name','plot(sinex)')
 % Call custom data , return 'plot(sinex)'
value_set=getappdata(Hnd1,'plot_name')
struct=getappdata(Hnd1)

% For some reason , The handle to the object is missing , You can find by function
% Gets the handle of the current image . If this image does not exist ,gcf  Will create a
Hnd1_gcf=gcf
% Returns the handle of the current coordinate system in the current image , If the image does not exist , Or there is no coordinate system in the current image ,
% So the function  gca  A coordinate system is created , And return its handle
Hnd1_gca=gca
% Returns the handle of the current object in the current image
Hnd1_gco=gco
% Find the attribute that contains the specified attribute , Object with specified value . You can specify multiple properties / value ,findobj  Returns only the object handle that matches it .
H_fig = findobj('Type', 'figure')


% Get location and units
position=get(gcf,'Position')
units=get(gcf,'Units')
版权声明
本文为[qq_ forty-one million nine hundred and fifty-five thousand two ]所创,转载请带上原文链接,感谢
https://yzsam.com/2022/04/202204212044441755.html
边栏推荐
猜你喜欢

金山云前COO刘志刚加入白海科技担任总裁

制造业数字化转型后发展的未来画像
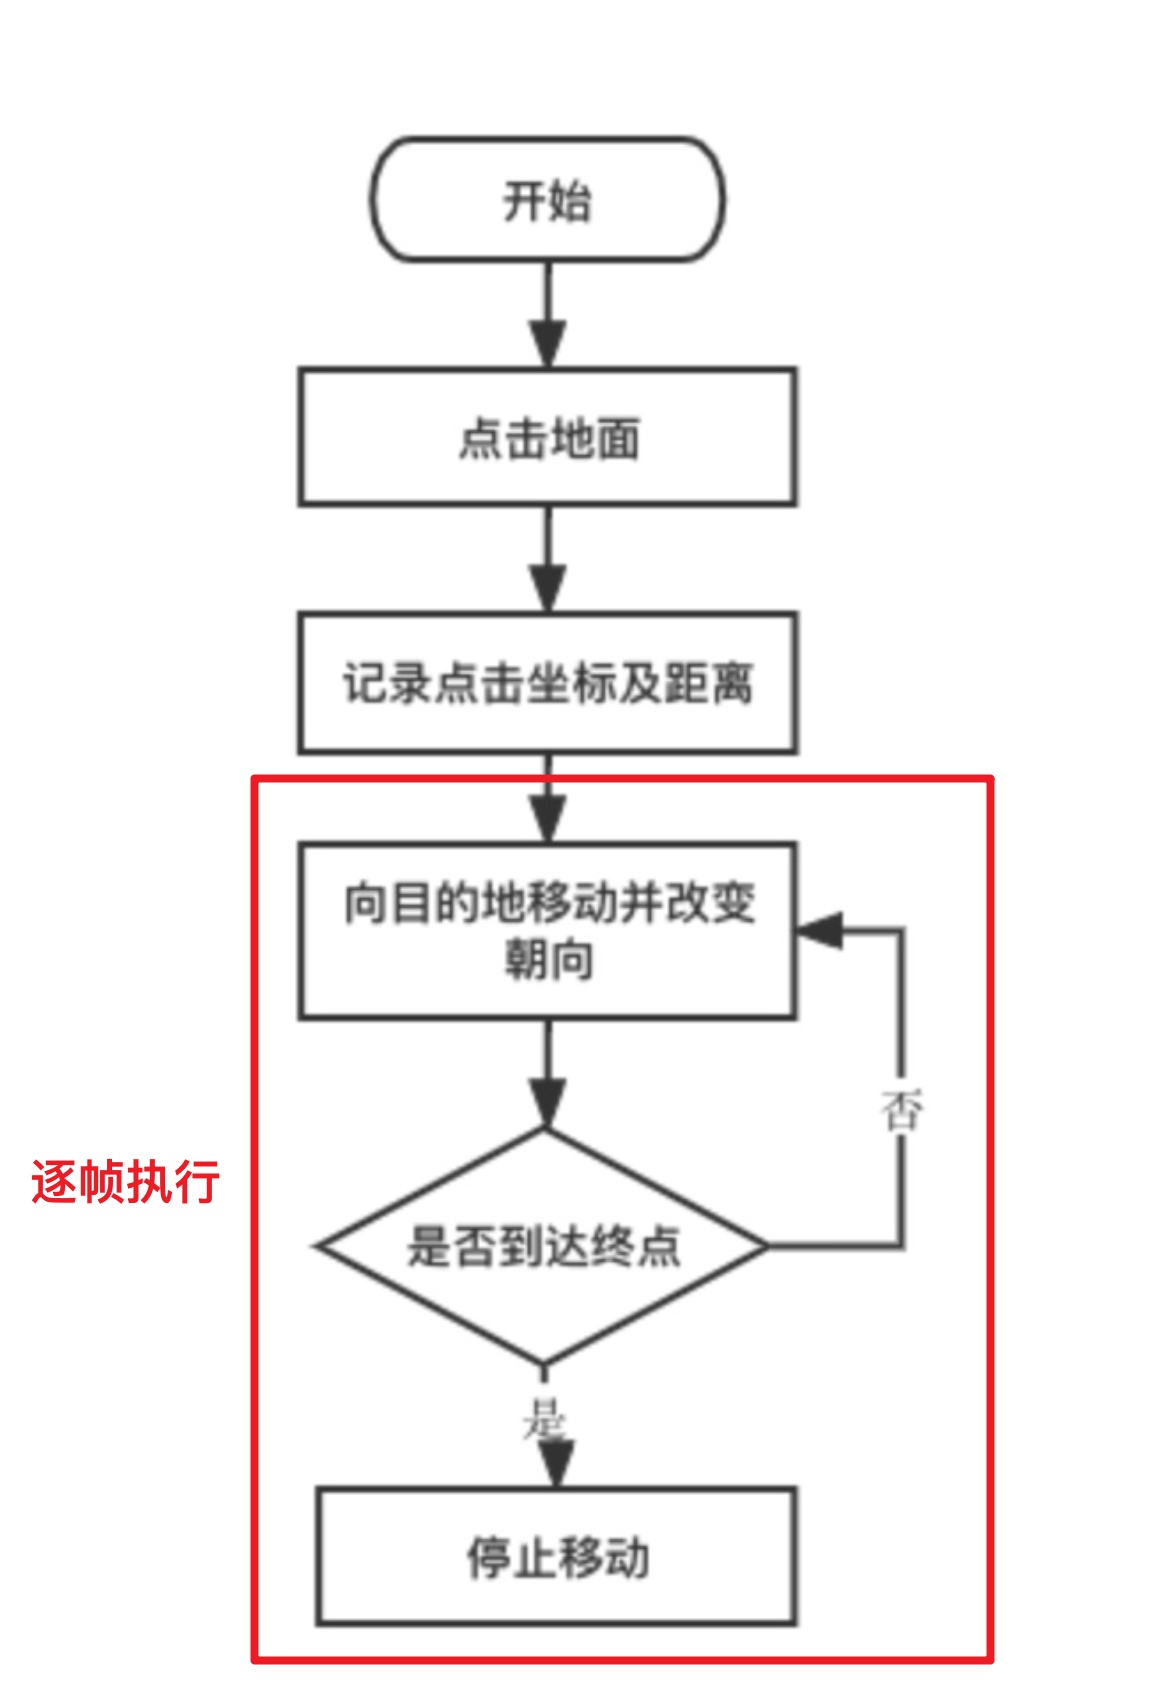
Click, walk and move of characters in 3D sandbox game
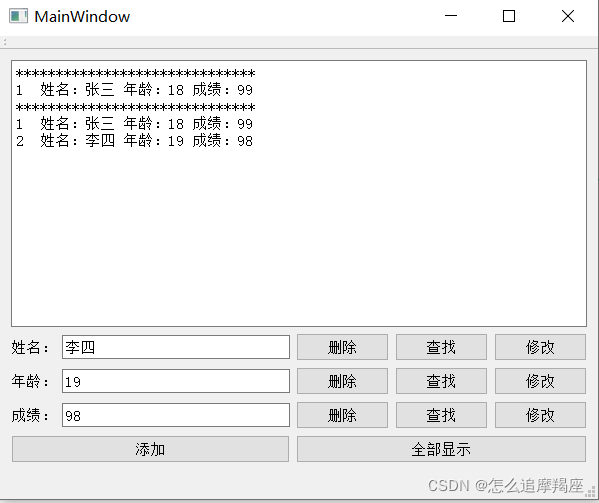
6、Qt使用MySQL例子

TGIP-CN 038 报名|深度解析 Apache Pulsar 源码阅读正确姿势(一)

Actual combat | UI automation test framework design and pageobject transformation
![[high concurrency] analysis of thread pool and ThreadPoolExecutor class](/img/9c/ccd119193ffb9b82bf08cedb38fd0b.jpg)
[high concurrency] analysis of thread pool and ThreadPoolExecutor class

Why do you have no idea when doing data analysis?

Channel allocation don't use the four-color theorem
![[azure application service] after azure function enables managed identity, error appears in PowerShell function: managedidentitycredential authentication failed](/img/81/adf80795cc22a887be2075ab3da0ef.png)
[azure application service] after azure function enables managed identity, error appears in PowerShell function: managedidentitycredential authentication failed
随机推荐
TGIP-CN 038 报名|深度解析 Apache Pulsar 源码阅读正确姿势(一)
AttributeError: ‘list‘ object has no attribute ‘endswich‘
如何用Sonic云真机打王者
Android Development Internship interview questions, Android development interview basis
《动手学机器人学》7.3.2动手学坐标变换 齐次矩阵生成(四元数+欧拉角)齐次坐标运算
After three years of graduation, he achieved nothing and was forced to go back to his hometown. He made a decision to change his life.
Mysql刷题题解_多表联查_浙江大学的用户在不同难度题目下答题的正确率情况,请取出相应数据,并按照准确率升序输出。
Weekly report from April 11, 2022 to April 17, 2022
Specific methods of configuring Profibus and PROFINET communication in two TIA botu projects
Tracup|使用项目管理软件帮助战胜拖延症
RTMP(3):Protocol Control Message
Andorid - - Pourquoi utiliser une transaction, qu'est - ce qu'une transaction commit et ROLLBACK?
人机验证reCAPTCHA v3使用完备说明
深度剖析TCP三次握手,面试官拍案叫绝
About c34d
oracle数据导入记录笔记
Circular linked list of single and double linked lists (XV)
Live555学习
Google mobile phone nexus and pixel series R & D code
6、Qt使用MySQL例子