Jupyter Notebook extension leveraging pandas DataFrames by integrating DataTables and ChartJS.

Overview

Jupyter DataTables

Jupyter Notebook extension to leverage pandas DataFrames by integrating DataTables JS.


About

Data scientists and in fact many developers work with pd.DataFrame on daily basis to interpret data to process them. In my typical workflow. The common workflow is to display the dataframe, take a look at the data schema and then produce multiple plots to check the distribution of the data to have a clearer picture, perhaps search some data in the table, etc...

What if those distribution plots were part of the standard DataFrame and we had the ability to quickly search through the table with minimal effort? What if it was the default representation?

The jupyter-datatables uses jupyter-require to draw the table.


Installation

pip install jupyter-datatables

Usage

import numpy as np
import pandas as pd

from jupyter_datatables import init_datatables_mode

init_datatables_mode()

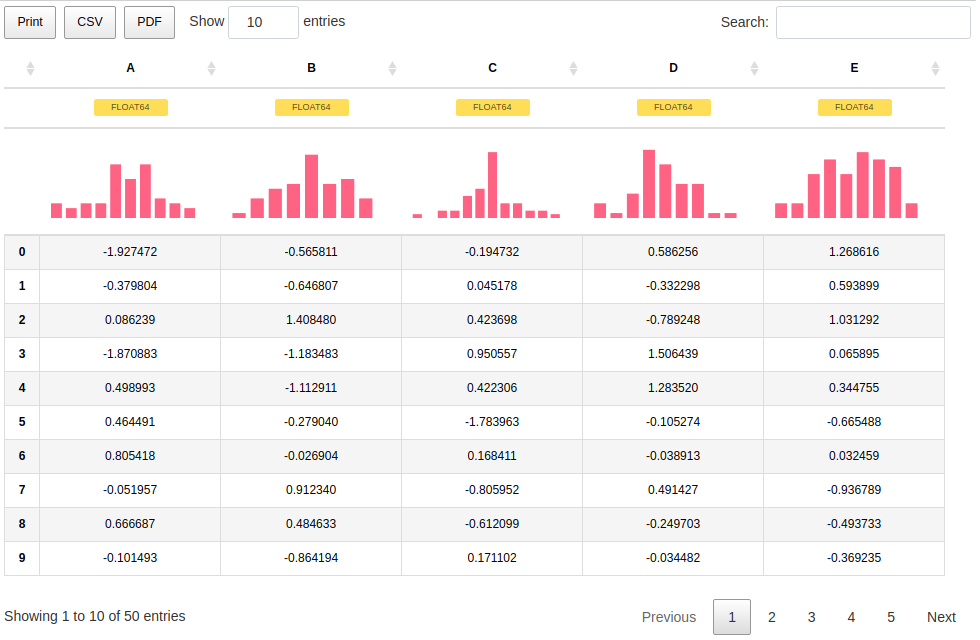
That's it, your default pandas representation will now use Jupyter DataTables!

df = pd.DataFrame(np.abs(np.random.randn(50, 5)), columns=list(string.ascii_uppercase[:5]))

Jupyter Datatables table representation


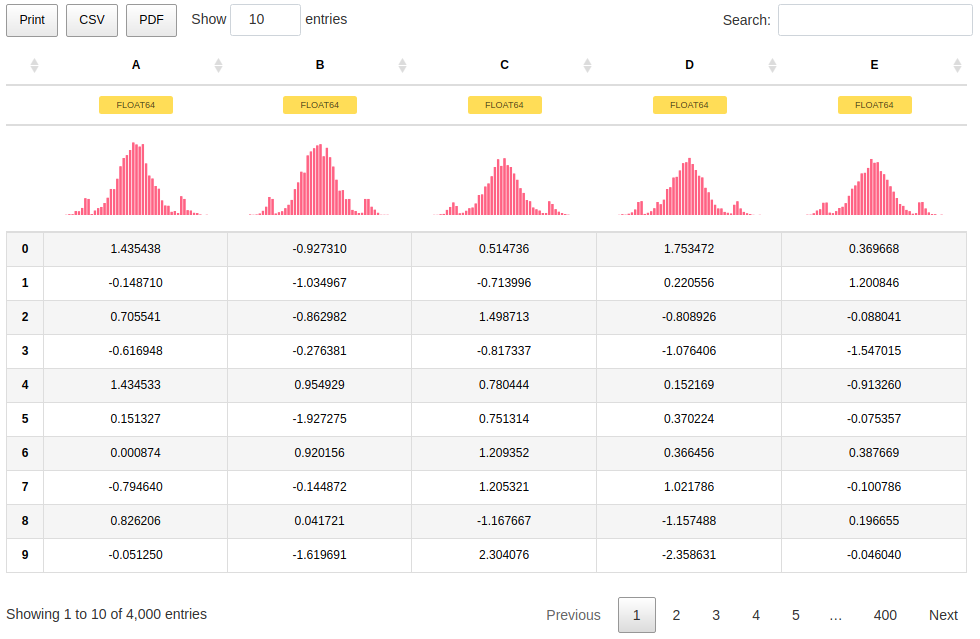
In most cases, you don't need to worry too much about the size of your data. Jupyter DataTables calculates required sample size based on a confidence interval (by default this would be 0.95) and margin of error and ceils it to the highest 'smart' value.

For example, for a data containing 100,000 samples, given 0.975 confidence interval and 0.02 margin of error, the Jupyter DataTables would calculate that 3044 samples are required and it would round it up to 4000.

Jupyter Datatables long table sample size

With additional note:

Sample size: 4,000 out of 100,000


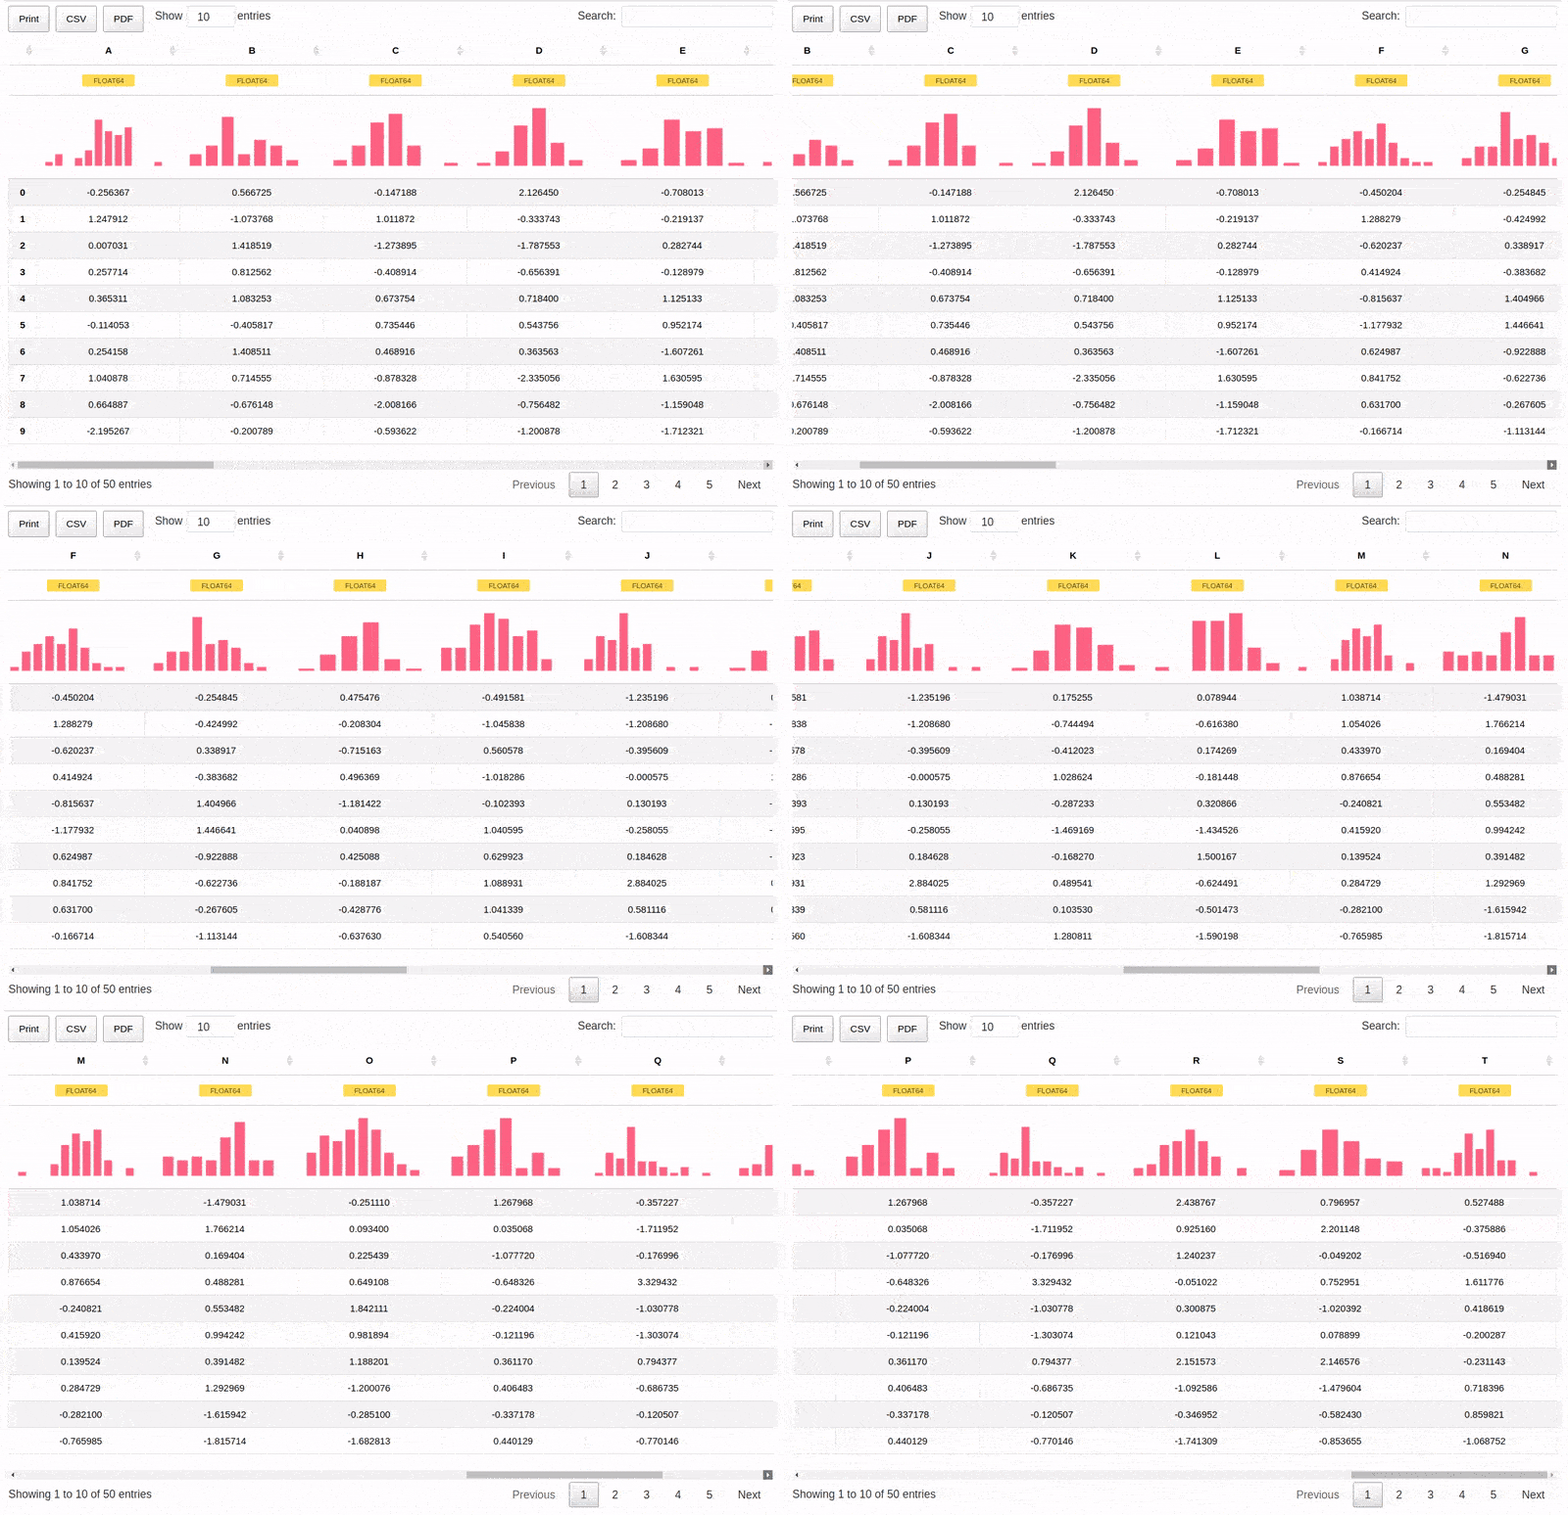
We can also handle wide tables with ease.

df = pd.DataFrame(np.abs(np.random.randn(50, 20)), columns=list(string.ascii_uppercase[:20]))

Jupyter Datatables wide table representation


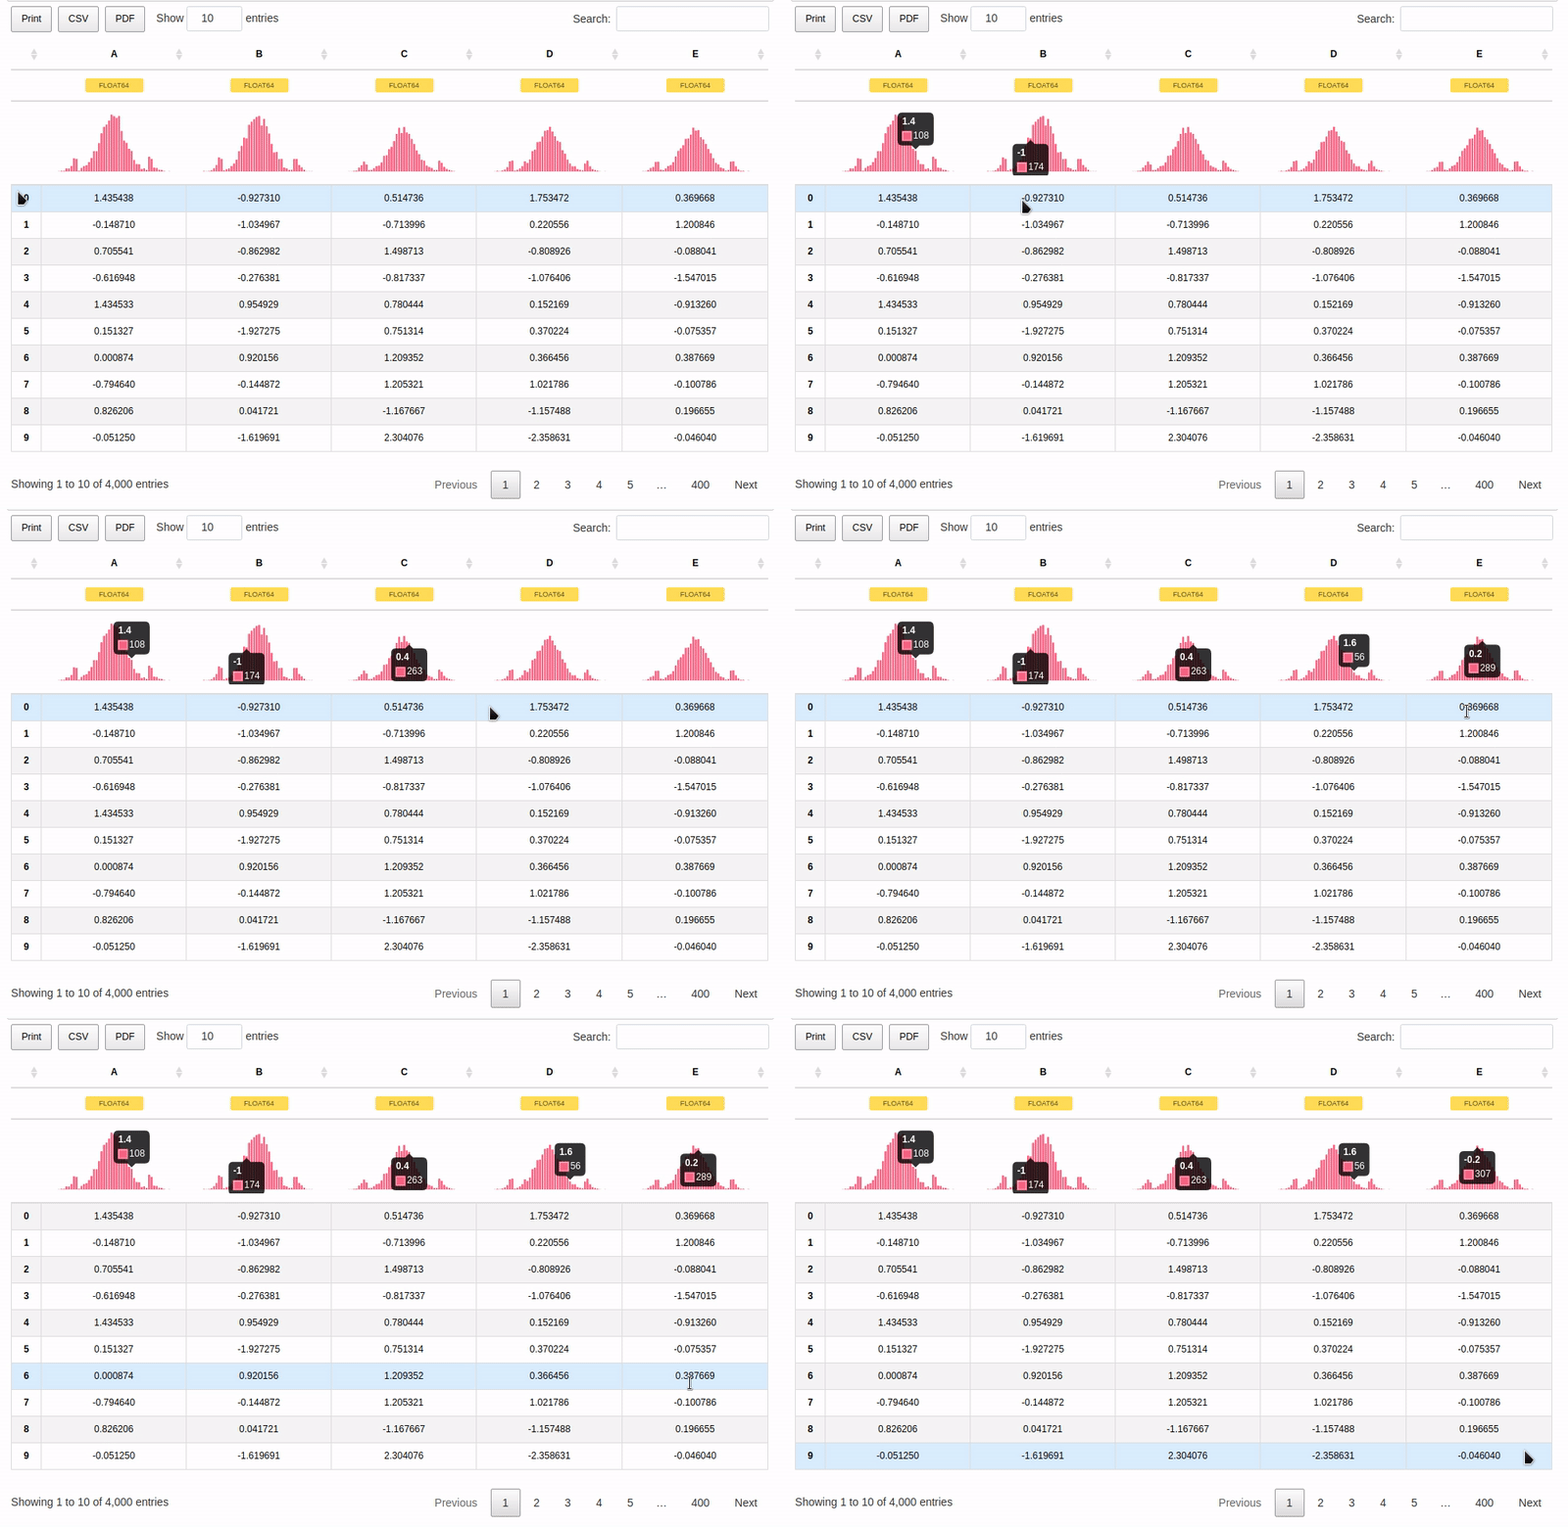
As per 0.3.0, there is a support for interactive tooltips:

Jupyter Datatables wide table representation

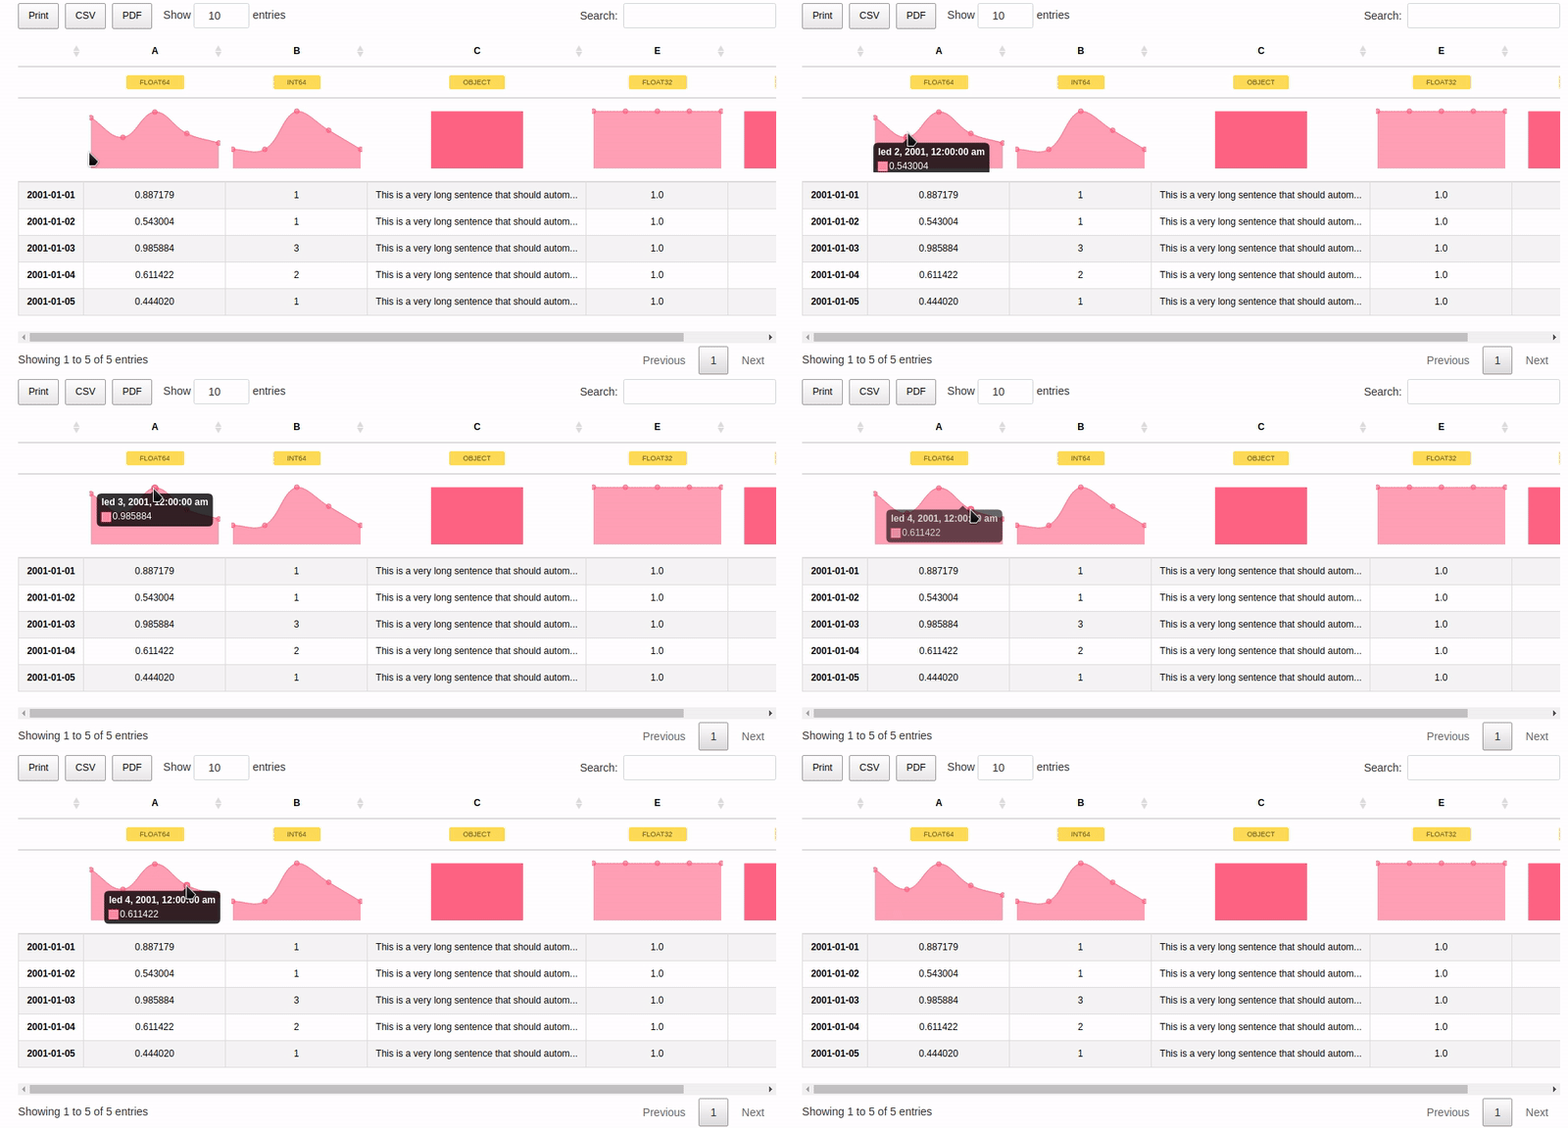
And also support for custom indices including Date type:

dft = pd.DataFrame({'A': np.random.rand(5),
                    'B': [1, 1, 3, 2, 1],
                    'C': 'This is a very long sentence that should automatically be trimmed',
                    'D': [pd.Timestamp('20010101'), pd.Timestamp('20010102'), pd.Timestamp('20010103'), pd.Timestamp('20010104'), pd.Timestamp('20010105')],
                    'E': pd.Series([1.0] * 5).astype('float32'),
                    'F': [False, True, False, False, True],
                   })

dft.D = dft.D.apply(pd.to_datetime)
dft.set_index('D', inplace=True)

Jupyter Datatables wide table representation


Current status and future plans:

Check out the Project Board where we track issues and TODOs for our Jupyter tooling!


Author: Marek Cermak [email protected], @AICoE
Owner
Marek Čermák
DevOps Engineer @ LivesportTV
Marek Čermák
Interactive Data Visualization in the browser, from Python

Bokeh is an interactive visualization library for modern web browsers. It provides elegant, concise construction of versatile graphics, and affords hi

Bokeh 17.1k Dec 31, 2022
The Metabolomics Integrator (MINT) is a post-processing tool for liquid chromatography-mass spectrometry (LCMS) based metabolomics.

MINT (Metabolomics Integrator) The Metabolomics Integrator (MINT) is a post-processing tool for liquid chromatography-mass spectrometry (LCMS) based m

Sören Wacker 0 May 04, 2022
A TileDB backend for xarray.

TileDB-xarray This library provides a backend engine to xarray using the TileDB Storage Engine. Example usage: import xarray as xr dataset = xr.open_d

TileDB, Inc. 14 Jun 02, 2021
Scientific measurement library for instruments, experiments, and live-plotting

PyMeasure scientific package PyMeasure makes scientific measurements easy to set up and run. The package contains a repository of instrument classes a

PyMeasure 445 Jan 04, 2023
A way of looking at COVID-19 data that I haven't seen before.

Visualizing Omicron: COVID-19 Deaths vs. Cases Click here for other countries. Data is from Our World in Data/Johns Hopkins University. About this pro

1 Jan 10, 2022
3D Vision functions with end-to-end support for deep learning developers, written in Ivy.

Ivy vision focuses predominantly on 3D vision, with functions for camera geometry, image projections, co-ordinate frame transformations, forward warping, inverse warping, optical flow, depth triangul

Ivy 61 Dec 29, 2022
Numerical methods for ordinary differential equations: Euler, Improved Euler, Runge-Kutta.

Numerical methods Numerical methods for ordinary differential equations are methods used to find numerical approximations to the solutions of ordinary

Aleksey Korshuk 5 Apr 29, 2022
A python wrapper for creating and viewing effects for Matt Parker's christmas tree.

Christmas Tree Visualizer A python wrapper for creating and viewing effects for Matt Parker's christmas tree. Displays py or csv effect files and allo

4 Nov 22, 2022
Python package to visualize and cluster partial dependence.

partial_dependence A python library for plotting partial dependence patterns of machine learning classifiers. The technique is a black box approach to

NYU Visualization Lab 25 Nov 14, 2022
python partial dependence plot toolbox

PDPbox python partial dependence plot toolbox Motivation This repository is inspired by ICEbox. The goal is to visualize the impact of certain feature

Li Jiangchun 723 Jan 07, 2023
:art: Diagram as Code for prototyping cloud system architectures

Diagrams Diagram as Code. Diagrams lets you draw the cloud system architecture in Python code. It was born for prototyping a new system architecture d

MinJae Kwon 27.5k Dec 30, 2022
GitHub English Top Charts

Help you discover excellent English projects and get rid of the interference of other spoken language.

kon9chunkit 529 Jan 02, 2023
flask extension for integration with the awesome pydantic package

Flask-Pydantic Flask extension for integration of the awesome pydantic package with Flask. Installation python3 -m pip install Flask-Pydantic Basics v

249 Jan 06, 2023
termplotlib is a Python library for all your terminal plotting needs.

termplotlib termplotlib is a Python library for all your terminal plotting needs. It aims to work like matplotlib. Line plots For line plots, termplot

Nico Schlömer 553 Dec 30, 2022
又一个云探针

ServerStatus-Murasame 感谢ServerStatus-Hotaru,又一个云探针诞生了(大雾 本项目在ServerStatus-Hotaru的基础上使用fastapi重构了服务端,部分修改了客户端与前端 项目还在非常原始的阶段,可能存在严重的问题 演示站:https://stat

6 Oct 19, 2021
Create 3d loss surface visualizations, with optimizer path. Issues welcome!

MLVTK A loss surface visualization tool Simple feed-forward network trained on chess data, using elu activation and Adam optimizer Simple feed-forward

7 Dec 21, 2022
A napari plugin for visualising and interacting with electron cryotomograms.

napari-tomoslice A napari plugin for visualising and interacting with electron cryotomograms. Installation You can install napari-tomoslice via pip: p

3 Jan 03, 2023
Monochromatic colorscheme for matplotlib with opinionated sensible default

Monochromatic colorscheme for matplotlib with opinionated sensible default If you need a simple monochromatic colorscheme for your matplotlib figures,

Aria Ghora Prabono 2 May 06, 2022
This GitHub Repository contains Data Analysis projects that I have completed so far! While most of th project are focused on Data Analysis, some of them are also put here to show off other skills that I have learned.

Welcome to my Data Analysis projects page! This GitHub Repository contains Data Analysis projects that I have completed so far! While most of th proje

Kyle Dini 1 Jan 31, 2022
Python Data Validation for Humans™.

validators Python data validation for Humans. Python has all kinds of data validation tools, but every one of them seems to require defining a schema

Konsta Vesterinen 670 Jan 09, 2023