Latex code for making neural networks diagrams

Overview

PlotNeuralNet

DOI

Latex code for drawing neural networks for reports and presentation. Have a look into examples to see how they are made. Additionally, lets consolidate any improvements that you make and fix any bugs to help more people with this code.

Examples

Following are some network representations:

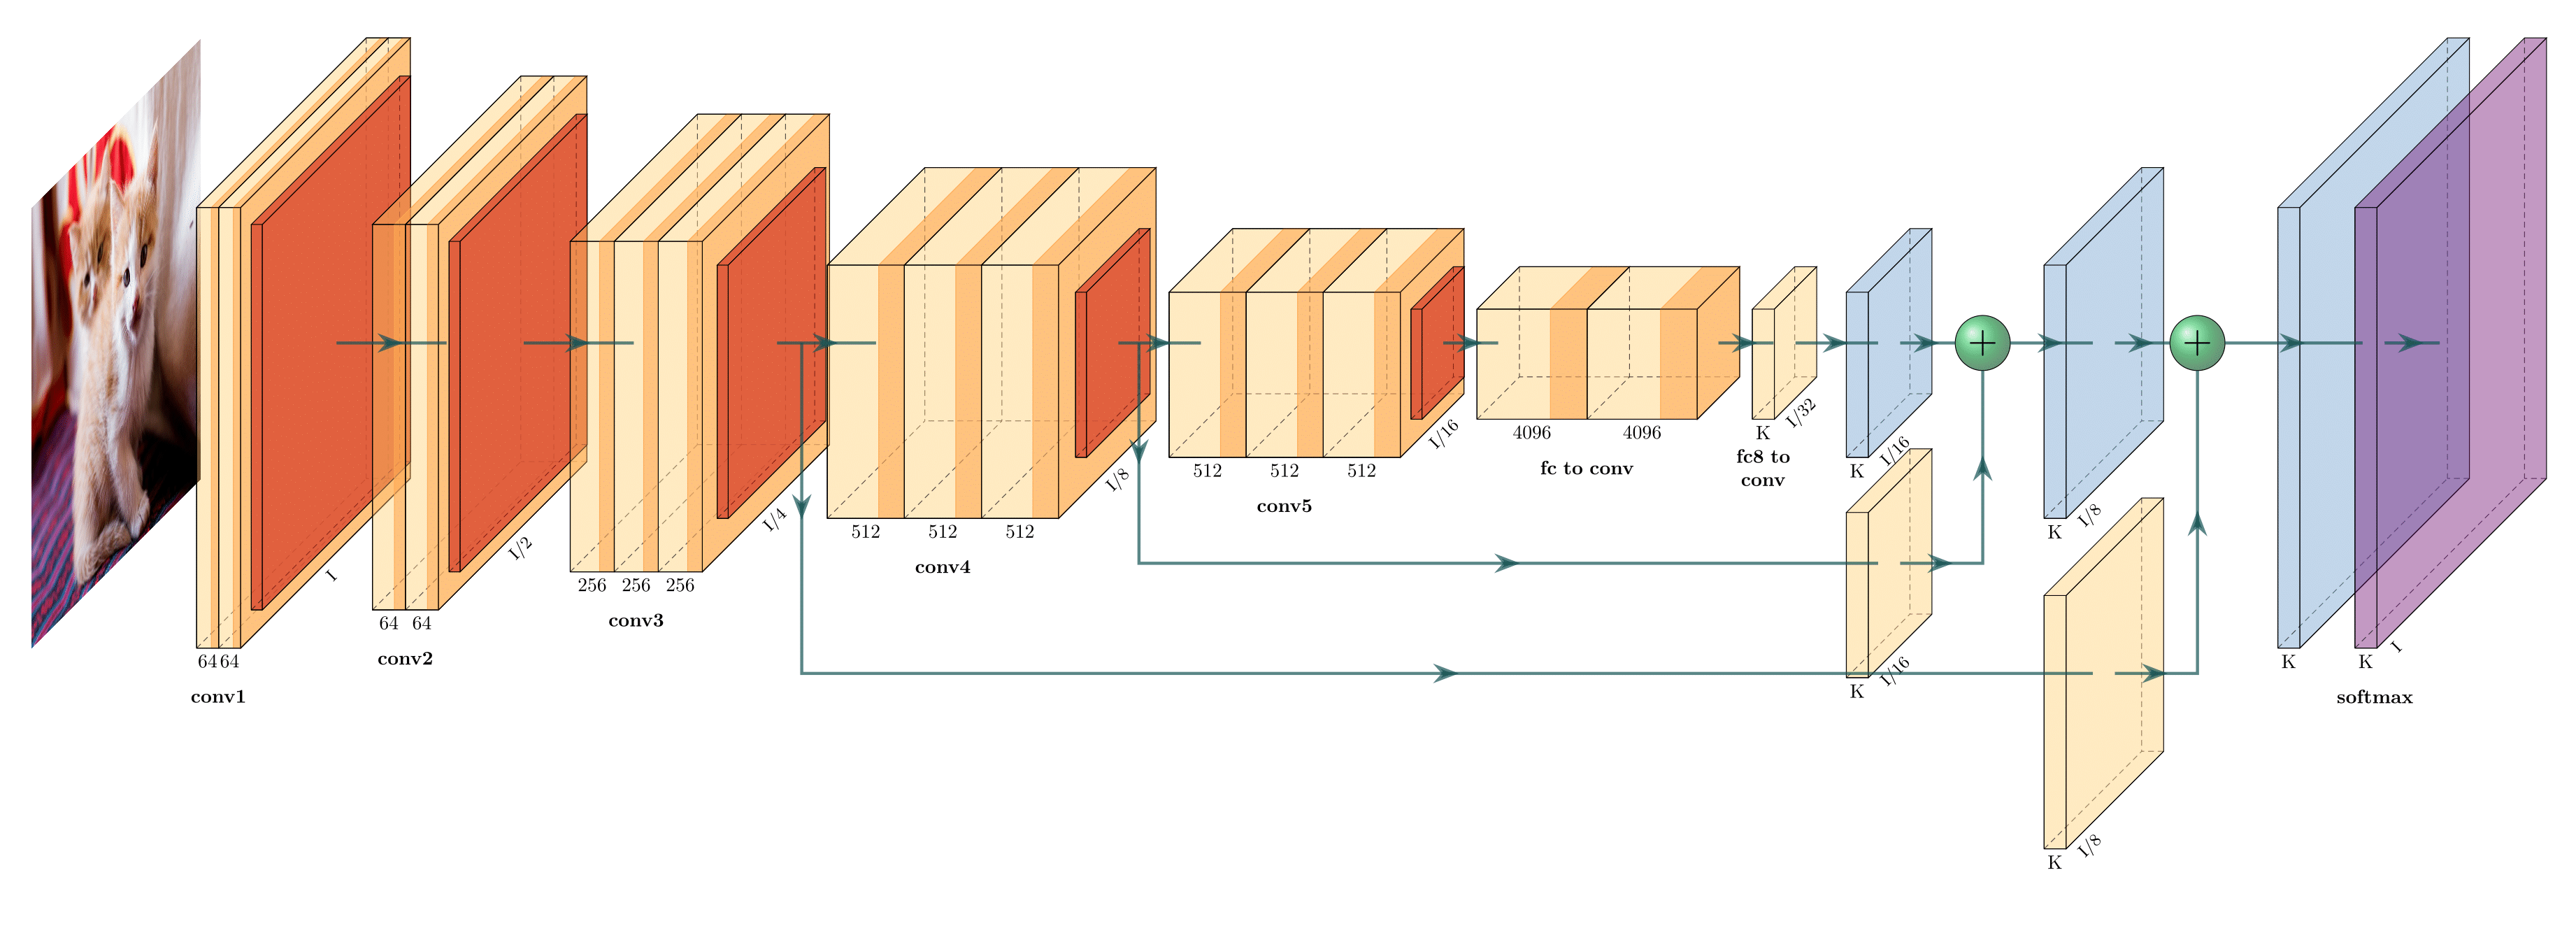
FCN-8 (view on Overleaf)

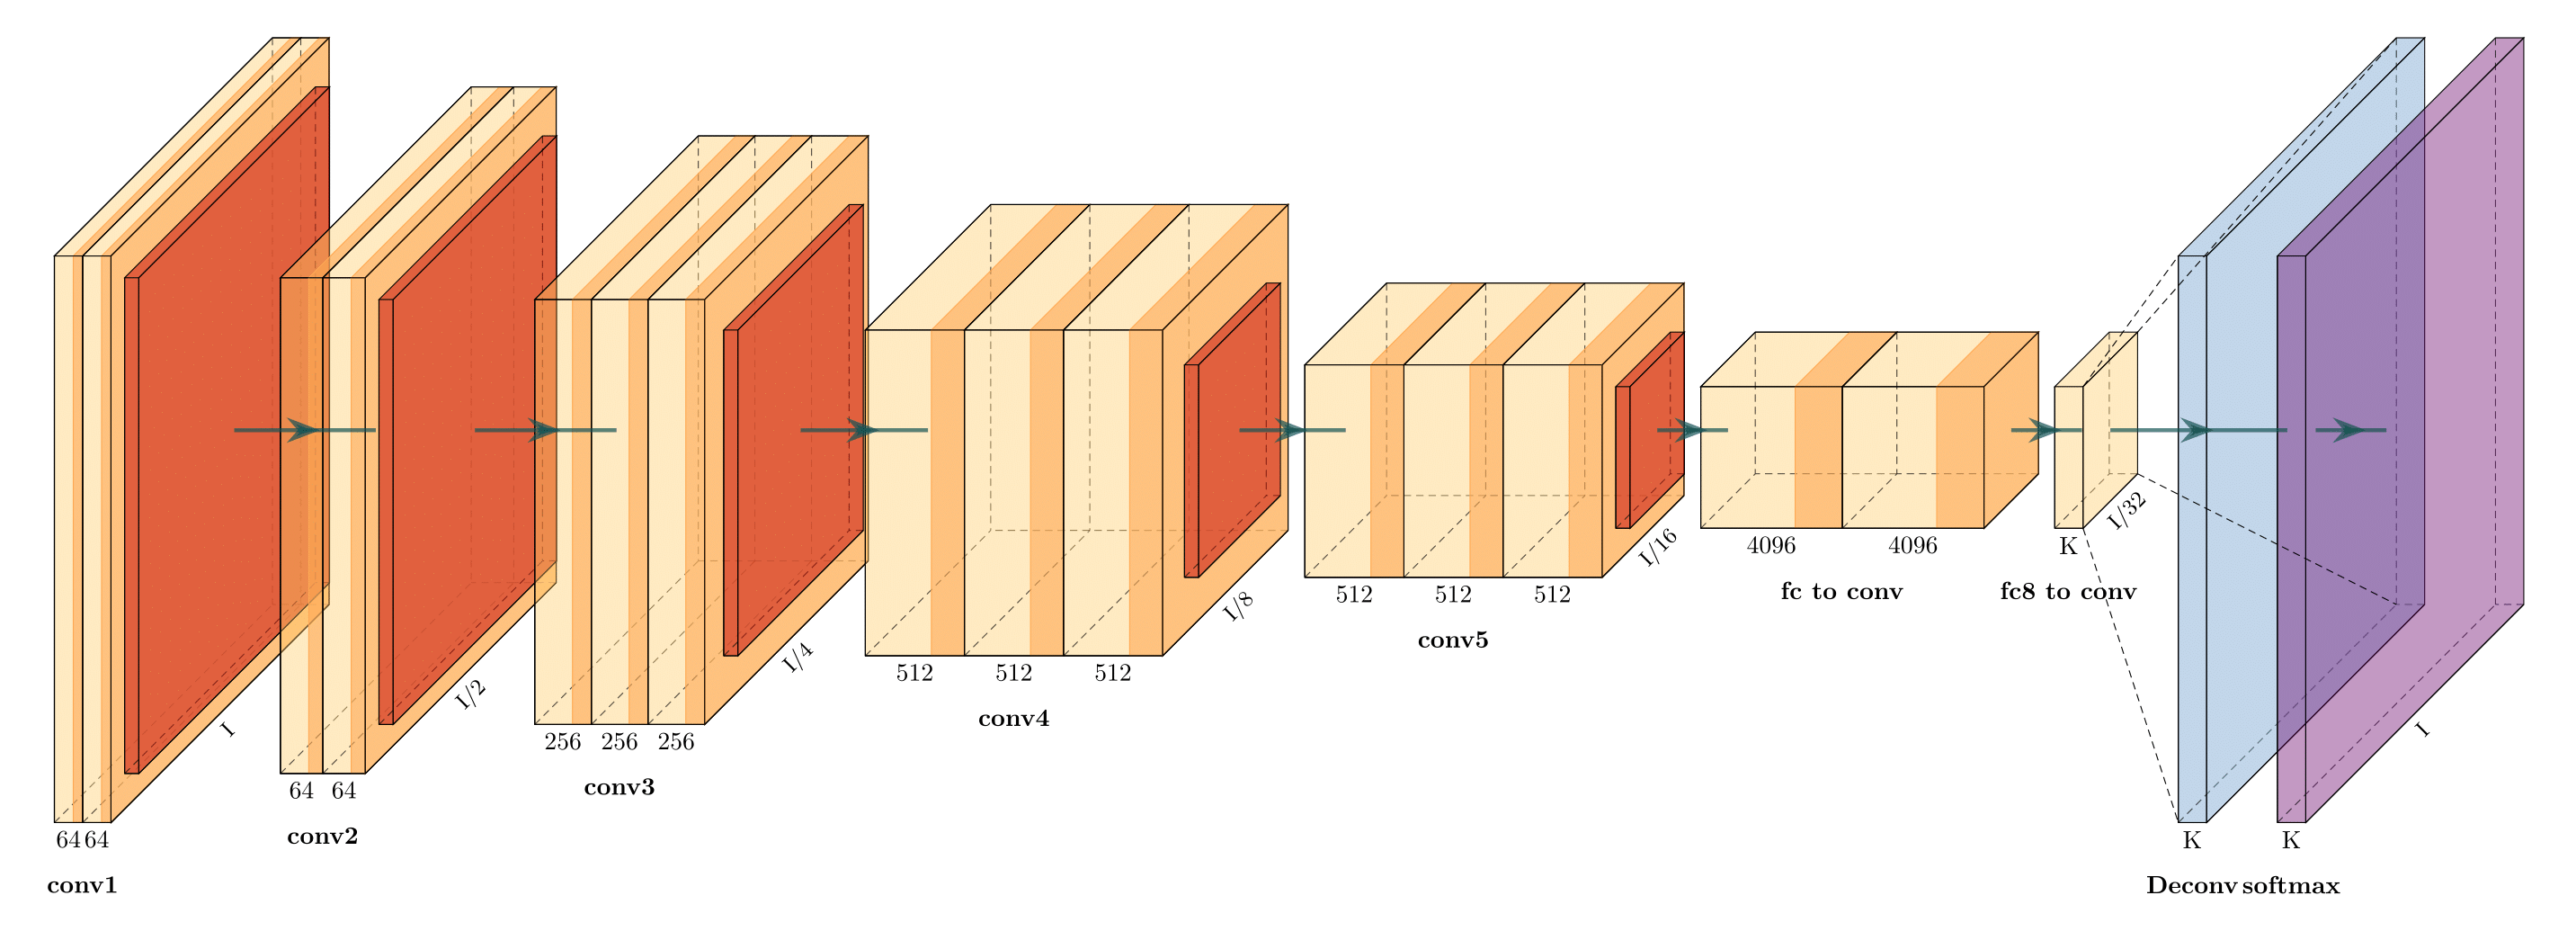
FCN-32 (view on Overleaf)

Holistically-Nested Edge Detection (view on Overleaf)

Getting Started

  1. Install the following packages on Ubuntu.

    • Ubuntu 16.04

      sudo apt-get install texlive-latex-extra
      
    • Ubuntu 18.04.2 Base on this website, please install the following packages.

      sudo apt-get install texlive-latex-base
      sudo apt-get install texlive-fonts-recommended
      sudo apt-get install texlive-fonts-extra
      sudo apt-get install texlive-latex-extra
      
    • Windows

    1. Download and install MikTeX.
    2. Download and install bash runner on Windows, recommends Git bash or Cygwin(https://www.cygwin.com/)
  2. Execute the example as followed.

    cd pyexamples/
    bash ../tikzmake.sh test_simple
    

TODO

  • Python interface
  • Add easy legend functionality
  • Add more layer shapes like TruncatedPyramid, 2DSheet etc
  • Add examples for RNN and likes.

Latex usage

See examples directory for usage.

Python usage

First, create a new directory and a new Python file:

$ mkdir my_project
$ cd my_project
vim my_arch.py

Add the following code to your new file:

import sys
sys.path.append('../')
from pycore.tikzeng import *

# defined your arch
arch = [
    to_head( '..' ),
    to_cor(),
    to_begin(),
    to_Conv("conv1", 512, 64, offset="(0,0,0)", to="(0,0,0)", height=64, depth=64, width=2 ),
    to_Pool("pool1", offset="(0,0,0)", to="(conv1-east)"),
    to_Conv("conv2", 128, 64, offset="(1,0,0)", to="(pool1-east)", height=32, depth=32, width=2 ),
    to_connection( "pool1", "conv2"),
    to_Pool("pool2", offset="(0,0,0)", to="(conv2-east)", height=28, depth=28, width=1),
    to_SoftMax("soft1", 10 ,"(3,0,0)", "(pool1-east)", caption="SOFT"  ),
    to_connection("pool2", "soft1"),
    to_end()
    ]

def main():
    namefile = str(sys.argv[0]).split('.')[0]
    to_generate(arch, namefile + '.tex' )

if __name__ == '__main__':
    main()

Now, run the program as follows:

bash ../tikzmake.sh my_arch
Comments
  • Error when running readme example: `I can't find file `tikzlibraryquotes.code.tex'`

    Error when running readme example: `I can't find file `tikzlibraryquotes.code.tex'`

    python my_arch.py works fine, producing the output included below. However, when I run pdflatex, I get error:

    ! I can't find file `tikzlibraryquotes.code.tex'.
    <argument> ...nput tikzlibrary\[email protected] .code.tex 
                                                      \catcode `\@ =\csname tikz...
    l.2 \usetikzlibrary{quotes,arrows.meta}
    

    I presume this is a simple fix requiring an install. Please may you help me diagnose what I need installed on my system for this to run? I am able to run tikz fine and create examples e.g. this one.

    LaTeX info

    $ pdflatex --version
    pdfTeX 3.1415926-2.5-1.40.14 (TeX Live 2013/Debian)
    kpathsea version 6.1.1
    Copyright 2013 Peter Breitenlohner (eTeX)/Han The Thanh (pdfTeX).
    There is NO warranty.  Redistribution of this software is
    covered by the terms of both the pdfTeX copyright and
    the Lesser GNU General Public License.
    For more information about these matters, see the file
    named COPYING and the pdfTeX source.
    Primary author of pdfTeX: Peter Breitenlohner (eTeX)/Han The Thanh (pdfTeX).
    Compiled with libpng 1.2.50; using libpng 1.2.50
    Compiled with zlib 1.2.8; using zlib 1.2.8
    Compiled with poppler version 0.24.5
    

    Python output:

    \documentclass[border=8pt, multi, tikz]{standalone} 
    \usepackage{import}
    \subimport{../layers/}{init}
    \usetikzlibrary{positioning}
    \usetikzlibrary{3d} %for including external image 
    
    
    \def\ConvColor{rgb:yellow,5;red,2.5;white,5}
    \def\ConvReluColor{rgb:yellow,5;red,5;white,5}
    \def\PoolColor{rgb:red,1;black,0.3}
    \def\UnpoolColor{rgb:blue,2;green,1;black,0.3}
    \def\FcColor{rgb:blue,5;red,2.5;white,5}
    \def\FcReluColor{rgb:blue,5;red,5;white,4}
    \def\SoftmaxColor{rgb:magenta,5;black,7}   
    
    
    \newcommand{\copymidarrow}{\tikz \draw[-Stealth,line width=0.8mm,draw={rgb:blue,4;red,1;green,1;black,3}] (-0.3,0) -- ++(0.3,0);}
    
    \begin{document}
    \begin{tikzpicture}
    \tikzstyle{connection}=[ultra thick,every node/.style={sloped,allow upside down},draw=\edgecolor,opacity=0.7]
    \tikzstyle{copyconnection}=[ultra thick,every node/.style={sloped,allow upside down},draw={rgb:blue,4;red,1;green,1;black,3},opacity=0.7]
    
    
    \pic[shift={(0,0,0)}] at (0,0,0) 
        {Box={
            name=conv1,
            caption= ,
            xlabel={{64, }},
            zlabel=512,
            fill=\ConvColor,
            height=64,
            width=2,
            depth=64
            }
        };
    
    
    \pic[shift={ (0,0,0) }] at (conv1-east) 
        {Box={
            name=pool1,
            caption= ,
            fill=\PoolColor,
            opacity=0.5,
            height=32,
            width=1,
            depth=32
            }
        };
    
    
    \pic[shift={(1,0,0)}] at (pool1-east) 
        {Box={
            name=conv2,
            caption= ,
            xlabel={{64, }},
            zlabel=128,
            fill=\ConvColor,
            height=32,
            width=2,
            depth=32
            }
        };
    
    
    \draw [connection]  (pool1-east)    -- node {\midarrow} (conv2-west);
    
    
    \pic[shift={ (0,0,0) }] at (conv2-east) 
        {Box={
            name=pool2,
            caption= ,
            fill=\PoolColor,
            opacity=0.5,
            height=28,
            width=1,
            depth=28
            }
        };
    
    
    \pic[shift={(3,0,0)}] at (pool1-east) 
        {Box={
            name=soft1,
            caption=SOFT,
            xlabel={{" ","dummy"}},
            zlabel=10,
            fill=\SoftmaxColor,
            opacity=0.8,
            height=3,
            width=1.5,
            depth=25
            }
        };
    
    
    \draw [connection]  (pool2-east)    -- node {\midarrow} (soft1-west);
    
    
    \end{tikzpicture}
    \end{document}
    
    opened by JamesOwers 8
  • Importing Standalone output to tex document

    Importing Standalone output to tex document

    Hey, Thanks for the tool, the graphics look awesome. I'm having some difficulty importing the outputted standalone tex file into a technical report of mine and was wondering if someone tried to do something similar and can help :) Thanks!

    opened by aklyussef 5
  • Fully Connected layer box

    Fully Connected layer box

    Below is the code that implements a fully connected layer box since I wasn't able to find it in the code. I used to_SoftMax function and modified it.

    The code should be put inside pycore/tikzeng.py file.

    def to_FullyConnected( name, s_filer=" ", n_filer=" ", offset="(0,0,0)", to="(0,0,0)", width=1.5, height=3, depth=25, opacity=0.8, caption=" " , zlabelposition='midway'):
        return r"""
    \pic[shift={"""+ offset +"""}] at """+ to +""" 
        {Box={
            name=""" + name +""",
            caption=""" +caption + """,
            xlabel={{ """+ '"'+str(n_filer) +'", "dummy"'+ """ }},
            zlabel="""+ str(s_filer) +""",
            zlabelposition="""+zlabelposition+""",
            fill=\FcColor,
            bandfill=\FcReluColor,
            opacity="""+ str(opacity) +""",
            height="""+ str(height) +""",
            width="""+ str(width) +""",
            depth="""+ str(depth) +"""
            }
        };
    """
    

    Cheers.

    opened by chrismaliszewski 5
  • to_input(...) doesn't have east, west... properties

    to_input(...) doesn't have east, west... properties

    I would like to connect the input image to conv blocks and other blocks, but it is not possible since to_input(...) doesn't have east, west, northeast, etc... properties. How to solve this? Maybe wrap to_input(...) in a box or something?

    opened by dougsouza 5
  • Unet to DenseNets

    Unet to DenseNets

    I am trying to modify Unet tex code to create DenseNets block. f838717a-6ad1-11e6-9391-f0906c80bc1d

    I am wondering how to modify the connection lines that then look like densenets style? Thank you for your time!

    opened by zuxfoucault 4
  • ModuleNotFoundError: No module named 'pycore.tikzeng'

    ModuleNotFoundError: No module named 'pycore.tikzeng'

    After running pip install pycore when I try to run in python: from pycore.tikzeng import * I got: ModuleNotFoundError: No module named 'pycore.tikzeng'

    Version: pycore==17.4.17

    opened by amirubin87 4
  • I want to know how to add legend

    I want to know how to add legend

    Hi, I wonder if there is a way of adding legend to the figure (identifying which color corresponds to which type of layer).

    A example default

    And how to eliminate cube number?

    opened by quinwu 4
  • Font size in the graph

    Font size in the graph

    Does anyone know how to change the font size in the graph? I tried to simply add to the documentclass

    \documentclass[border=15pt, multi, tikz]{standalone}

    but it doesn't work and returns some errors with positioning.

    opened by wufeim 3
  • unet error

    unet error

    pyexamples|master⚡ ⇒ bash ../tikzmake.sh unet

    File "unet.py", line 19 block_2ConvPool( name='b2', botton='pool_b1', top='pool_b2', s_filer=256, n_filer=128, offset="(1,0,0)", size=(32,32,3.5), opacity=0.5 ), ^ SyntaxError: invalid syntax This is pdfTeX, Version 3.14159265-2.6-1.40.19 (TeX Live 2018) (preloaded format=pdflatex) restricted \write18 enabled. entering extended mode ! I can't find file `unet.tex'. <> unet.tex

    (Press Enter to retry, or Control-D to exit) Please type another input file name: ^D ! Emergency stop. <*> unet.tex

    ! ==> Fatal error occurred, no output PDF file produced! Transcript written on texput.log. rm: *.aux: No such file or directory rm: *.vscodeLog: No such file or directory rm: *.tex: No such file or directory ../tikzmake.sh: line 10: xdg-open: command not found

    opened by wm901115nwpu 3
  • Labeling Blocks will create a solid line

    Labeling Blocks will create a solid line

    I tried to let the Box block's edges be invisible via fill=\fill, draw=\fill in Box.sty.

    Actually, It only let edges AH, AD, DE, CD, EF and HE invisible.

    Finally I found that \path (b) edge ["\bf\xlabel"', midway] (c); created a solid line in BC, so do AB and CF.

    I have no idea to fix this and I don't know why the solid lines emerged though no pic action acted in above code.

    Furthermore, I want customize the style of draw line, but nothing changes after I put thin into "box" style setting.

    opened by omegahh 3
  • What does the single quotation mark which follows double quotation marks mean?

    What does the single quotation mark which follows double quotation marks mean?

    Thanks for your amazing work! I am confused with the quotation mark like "\cubezlabel"'. What is the difference between "\cubezlabel".

    Looking forwarding your answer:)

    opened by omegahh 3
  • Made python interface installable via pip

    Made python interface installable via pip

    Hi, HarisIqbal88!

    My boss told me to use your package for my master thesis and I really like it, but it was bugging me, that it didn't have an installer. So I made it installable via pip. I had to rearrange your directories a little bit, but I hope you like it.

    I also added CITATION.cff, this will show how to cite your software directly in the repos sidebar.

    You might want to add your email or ORCID in pyproject.toml and check CITATION.cff for errors.

    I wish you a happy New Year!

    Kind regards, Jonas Eichhorn

    opened by AlreadyTakenJonas 1
  • Add a documentation

    Add a documentation

    Hello,

    Thank you for the good work.

    Please can you work toward doing a good documentation for this repo ? Some arguments are not clearly defined, and it's not clear what values we should use etc.. a proper documentation would be greatly appreciated !

    Cordially

    opened by NicolasNerr 0
  • Add arrow as legend (U-Net Model)

    Add arrow as legend (U-Net Model)

    How can I use an arrow as a legend of the plot? Please give me an example!

    Model architecture: U-Net (I want to plot "concatenate arrows" in U-Net as legend)

    image

    opened by mehrdad-dev 0
Releases(v1.0.0)
  • v1.0.0(Dec 25, 2018)

    This is the first release that is built on the idea to further extend the functionality with maximum backward compatibility. Layer names(e.g., Box,RightBandedBox) and their attributes(e.g., caption,xlabels) are generic. Moreover, the code is much better readable than the previous version. TO DO's:

    • Add easy legend functionality
    • Add more layer shapes like TruncatedPyramid, 2DSheet etc
    Source code(tar.gz)
    Source code(zip)
  • v0.1(Dec 25, 2018)

    This is the very first release in which layers were defined by specific names like Conv, ConvRelu,Deconv and a workable solution was created. This version is not suitable for extension because having a separate layer just because it is represented by a different colour is not clever. In future release, layers should be defined in generic terms like Box, RightBandedBox, Ball etc so that less code can make different layers with colour as a parameter. Additionally, attributes of each layer should also be changed to generic for example: from numFilters to xlabels

    Source code(tar.gz)
    Source code(zip)
Owner
Haris Iqbal
Computer Science Student at Saarland University
Haris Iqbal
Repo for "Event-Stream Representation for Human Gaits Identification Using Deep Neural Networks"

Summary This is the code for the paper Event-Stream Representation for Human Gaits Identification Using Deep Neural Networks by Yanxiang Wang, Xian Zh

zhangxian 54 Jan 03, 2023
Get started with Machine Learning with Python - An introduction with Python programming examples

Machine Learning With Python Get started with Machine Learning with Python An engaging introduction to Machine Learning with Python TL;DR Download all

Learn Python with Rune 130 Jan 02, 2023
SmoothGrad implementation in PyTorch

SmoothGrad implementation in PyTorch PyTorch implementation of SmoothGrad: removing noise by adding noise. Vanilla Gradients SmoothGrad Guided backpro

SSKH 143 Jan 05, 2023
JudeasRx - graphical app for doing personalized causal medicine using the methods invented by Judea Pearl et al.

JudeasRX Instructions Read the references given in the Theory and Notation section below Fire up the Jupyter Notebook judeas-rx.ipynb The notebook dra

Robert R. Tucci 19 Nov 07, 2022
The first public PyTorch implementation of Attentive Recurrent Comparators

arc-pytorch PyTorch implementation of Attentive Recurrent Comparators by Shyam et al. A blog explaining Attentive Recurrent Comparators Visualizing At

Sanyam Agarwal 150 Oct 14, 2022
MoveNet Single Pose on OpenVINO

MoveNet Single Pose tracking on OpenVINO Running Google MoveNet Single Pose models on OpenVINO. A convolutional neural network model that runs on RGB

35 Nov 11, 2022
Implementation of temporal pooling methods studied in [ICIP'20] A Comparative Evaluation Of Temporal Pooling Methods For Blind Video Quality Assessment

Implementation of temporal pooling methods studied in [ICIP'20] A Comparative Evaluation Of Temporal Pooling Methods For Blind Video Quality Assessment

Zhengzhong Tu 5 Sep 16, 2022
SoK: Vehicle Orientation Representations for Deep Rotation Estimation

SoK: Vehicle Orientation Representations for Deep Rotation Estimation Raymond H. Tu, Siyuan Peng, Valdimir Leung, Richard Gao, Jerry Lan This is the o

FIRE Capital One Machine Learning of the University of Maryland 12 Oct 07, 2022
TensorRT examples (Jetson, Python/C++)(object detection)

TensorRT examples (Jetson, Python/C++)(object detection)

Nobuo Tsukamoto 53 Dec 22, 2022
Web-interface + rest API for classification and regression (https://jeff1evesque.github.io/machine-learning.docs)

Machine Learning This project provides a web-interface, as well as a programmatic-api for various machine learning algorithms. Supported algorithms: S

Jeff Levesque 252 Dec 11, 2022
Example of a Quantum LSTM

Example of a Quantum LSTM

Riccardo Di Sipio 36 Oct 31, 2022
Image Segmentation using U-Net, U-Net with skip connections and M-Net architectures

Brain-Image-Segmentation Segmentation of brain tissues in MRI image has a number of applications in diagnosis, surgical planning, and treatment of bra

Angad Bajwa 8 Oct 27, 2022
ECAENet (TensorFlow and Keras)

ECAENet: EfficientNet with Efficient Channel Attention for Plant Species Recognition (SCI:Q3) (Journal of Intelligent & Fuzzy Systems)

4 Dec 22, 2022
Fit Fast, Explain Fast

FastExplain Fit Fast, Explain Fast Installing pip install fast-explain About FastExplain FastExplain provides an out-of-the-box tool for analysts to

8 Dec 15, 2022
Source code for paper "Deep Superpixel-based Network for Blind Image Quality Assessment"

DSN-IQA Source code for paper "Deep Superpixel-based Network for Blind Image Quality Assessment" Requirements Python =3.8.0 Pytorch =1.7.1 Usage wit

7 Oct 13, 2022
A toolkit for document-level event extraction, containing some SOTA model implementations

❤️ A Toolkit for Document-level Event Extraction with & without Triggers Hi, there 👋 . Thanks for your stay in this repo. This project aims at buildi

Tong Zhu(朱桐) 159 Dec 22, 2022
📝 Wrapper library for text generation / language models at char and word level with RNN in TensorFlow

tensorlm Generate Shakespeare poems with 4 lines of code. Installation tensorlm is written in / for Python 3.4+ and TensorFlow 1.1+ pip3 install tenso

Kilian Batzner 63 May 22, 2021
PyTorch implementation of SwAV (Swapping Assignments between Views)

Unsupervised Learning of Visual Features by Contrasting Cluster Assignments This code provides a PyTorch implementation and pretrained models for SwAV

Meta Research 1.7k Jan 04, 2023
Nonnegative spatial factorization for multivariate count data

Nonnegative spatial factorization for multivariate count data This repository contains supporting code to facilitate reproducible analysis. For detail

Will Townes 24 Dec 19, 2022
Small utility to demangle Nim symbols in callgrind files

nim_callgrind A small utility to demangle Nim symbols from callgrind files. Usage Run your (Nim) program with something like this: valgrind --tool=cal

kraptor 3 Feb 15, 2022