Visualize the bitcoin blockchain from your local node

Overview

Project Overview

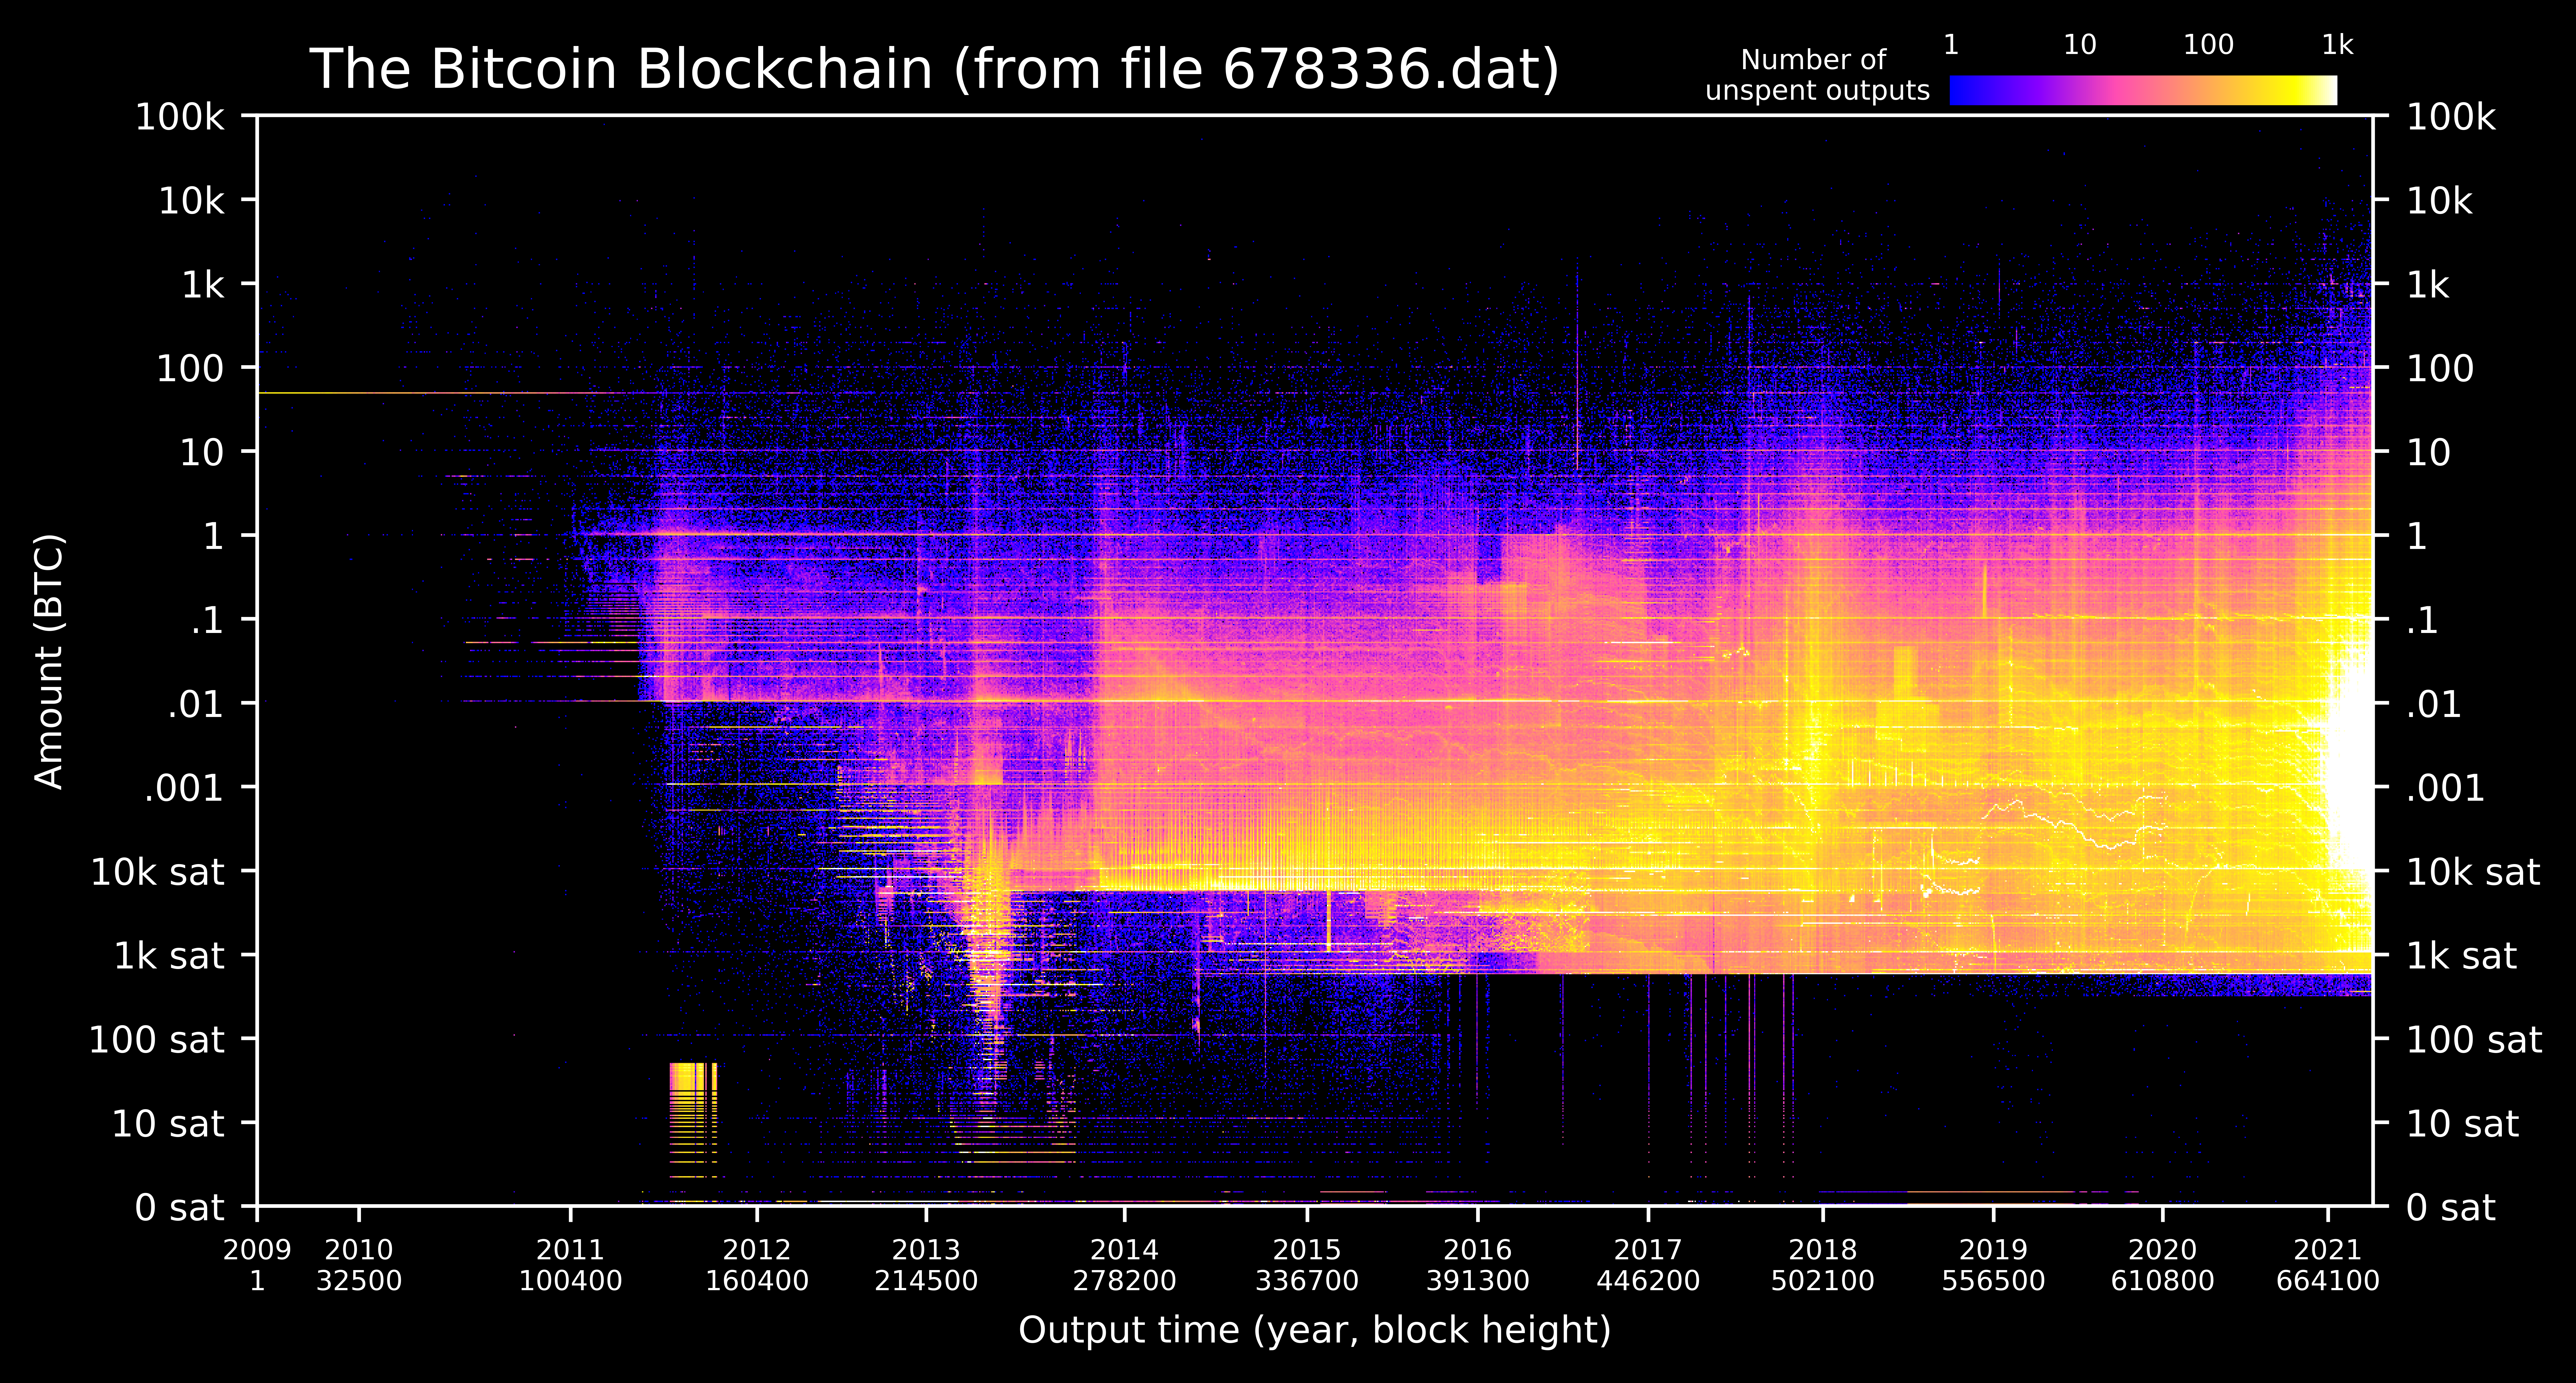
A new feature in Bitcoin Core 0.20 allows users to dump the state of the blockchain (the UTXO set) using the command dumptxoutset. I've written a python script utxo-live.py that takes the ouput of dumptxoutset and generates a heatmap of the blockchain via the UTXO set. Thus all of the active bitcoin in the blockchain is visualized in a single image from your own node.


Logo

Figure description: The heatmap is a two dimensional histogram showing the output date (x-axis), BTC amount (y-axis), and number of unspent outputs (color map) in each histogram bin. The BTC amounts on the y-axis are log scale and there are 100 bins in each log decade (e.g. 100 bins between 1 and 10 BTC). The bin size of output dates is one day. Zooming in to the image usually reveals more detail. A daily updating version of this image is running at utxo.live.

Privacy & Security

With the new dumptxouset command, the python script no longer requires an RPC password to access Core's databases. The script simply reads the dump file without interacting with Core at all. No private keys, passwords, xpubs, or wallet addresses are exchanged between Core and the python script.

Requirements

  • Bitcoin Core version 0.20 or higher
  • Python3 (comes standard on all operating systems)

Instructions for experienced users

  • Create a folder called utxo-live in a familiar location
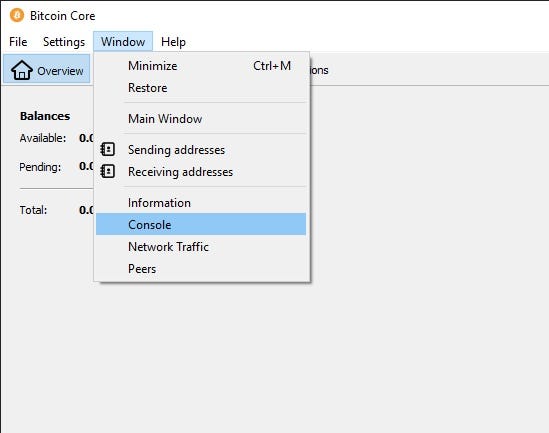
  • Dump the utxo set bitcoin-cli dumptxoutset /xxxxxx.dat where xxxxxxx is the current block height (10-20 min) (Note: bitcoin-cli doesn't ship with Core on Mac OS, use Window->Console instead)
  • Install two python dependencies python3 -m pip install numpy matplotlib
  • Download utxo-live.py to your utxo-live folder and run it python3 utxo-live.py (20 min)

Step by step instructions

  1. Make sure Bitcoin Core (version 0.20 or higher) is running and synchronized.

  2. Create a new folder called utxo-live in a familiar location on your machine (e.g. in your Documents folder).

  3. Open a terminal window and display the current folder path. Do this by:

  • Windows: open a terminal (Start -> Command Prompt) and type:
echo %cd%
  • Mac/Linux: open a terminal (Mac: Applications -> Utilities -> Terminal) and type:
pwd
  1. Navigate to the utxo-live folder using the change directory cd command. For example if you're currently in Users/Steve/ (or on Windows C:\Users\Steve\) and you've created the folder Steve/Documents/bitcoin-tools/utxo-live/ then type:
cd Document/bitcoin-tools/utxo-live/

Note: Windows sometimes requires forward slashes / instead of back slashes \.

  1. Again display the current folder (Step 3) and copy to your clipboard the full path to the utxo-live folder. We will be pasting this path into Bitcoin Core soon.

  2. Leave the terminal window momentarily, and open the Bitcoin Core console window. (Alternatively for bitcoin-cli users, open another terminal window and type the console commands in the next steps as bitcoin-cli commands.)

Open Console Pic

  1. Get the current block count by typing in the console window:
getblockcount

and hitting enter. The output will look like:

  1. Dump the current utxo set by typing in the console window:
  dumptxoutset <PATH to utxo-live>/<xxxxxx.dat>

where is copy-pasted from Step 5, and is the block count. For example if the block count is 678505, the command (for my path) is:

  dumptxoutset /Users/Steve/Documents/bitcoin-tools/utxo-live/678505.dat

If there are no error messages after hitting enter, then it's working. It will take 10-20 minutes. Look in your utxo-live folder and you should see the file being created as xxxxxx.dat.incomplete.

  1. While the utxo file is dumping, download utxo-live.py and install two python dependencies. To do this:
  • Right click on utxo-live.py, choose "Save Link As" and select the utxo-live folder.

  • In the terminal window (not the Bitcoin console), type the following command to install two python dependencies:

  python3 -m pip install numpy matplotlib

Note: you might already have these installed, but running the command won't hurt anything.

  1. If 10-20 minutes have passed, check that the utxo dump is completed. Do this in two ways:
  • Check that the file no longer has .incomplete after xxxxxx.dat
  • Check that the Bitcoin Core console displays the results of the dump as something like:

  1. If the dump file is finished and Step 9 is completed (utxo-live.py is downloaded and python dependencies were installed), then run utxo-live.py by typing in the terminal:
  python3 utxo-live.py
  1. The program will take 20-30 minutes to complete and it will update you on the progress. If there are multiple xxxxxxx.dat files in the folder, it will ask you which one you'd like to process. When finished the image is stored in the folder as utxo_heatmap_xxxxxx.png.

Acknowledgements

I'm indebted to three main projects for the code, understanding, and inspiration for this project. The python functions that parse and decode the utxo dump file were adapted from Bitcoin_Tools. I learned how Core serializes utxos from Bitcoin-UTXO-Dump . An inspiring project that visualizes changes in the UTXO set as a movie is BitcoinUtxoVisualizer .
A data visualization curriculum of interactive notebooks.

A data visualization curriculum of interactive notebooks, using Vega-Lite and Altair. This repository contains a series of Python-based Jupyter notebooks.

UW Interactive Data Lab 1.2k Dec 30, 2022
A deceptively simple plotting library for Streamlit

🍅 Plost A deceptively simple plotting library for Streamlit. Because you've been writing plots wrong all this time. Getting started pip install plost

Thiago Teixeira 192 Dec 29, 2022
GitHub English Top Charts

Help you discover excellent English projects and get rid of the interference of other spoken language.

kon9chunkit 529 Jan 02, 2023
Library for exploring and validating machine learning data

TensorFlow Data Validation TensorFlow Data Validation (TFDV) is a library for exploring and validating machine learning data. It is designed to be hig

688 Jan 03, 2023
:small_red_triangle: Ternary plotting library for python with matplotlib

python-ternary This is a plotting library for use with matplotlib to make ternary plots plots in the two dimensional simplex projected onto a two dime

Marc 611 Dec 29, 2022
The official colors of the FAU as matplotlib/seaborn colormaps

FAU - Colors The official colors of Friedrich-Alexander-Universität Erlangen-Nürnberg (FAU) as matplotlib / seaborn colormaps. We support the old colo

Machine Learning and Data Analytics Lab FAU 9 Sep 05, 2022
Bioinformatics tool for exploring RNA-Protein interactions

Explore RNA-Protein interactions. RNPFind is a bioinformatics tool. It takes an RNA transcript as input and gives a list of RNA binding protein (RBP)

Nahin Khan 3 Jan 27, 2022
Lime: Explaining the predictions of any machine learning classifier

lime This project is about explaining what machine learning classifiers (or models) are doing. At the moment, we support explaining individual predict

Marco Tulio Correia Ribeiro 10.3k Dec 29, 2022
Create a visualization for Trump's Tweeted Words Using Python

Data Trump's Tweeted Words This plot illustrates twitter word occurences. We already did the coding I needed for this plot, so I was very inspired to

7 Mar 27, 2022
Implementation of SOMs (Self-Organizing Maps) with neighborhood-based map topologies.

py-self-organizing-maps Simple implementation of self-organizing maps (SOMs) A SOM is an unsupervised method for learning a mapping from a discrete ne

Jonas Grebe 6 Nov 22, 2022
Glue is a python project to link visualizations of scientific datasets across many files.

Glue Glue is a python project to link visualizations of scientific datasets across many files. Click on the image for a quick demo: Features Interacti

675 Dec 09, 2022
Python ts2vg package provides high-performance algorithm implementations to build visibility graphs from time series data.

ts2vg: Time series to visibility graphs The Python ts2vg package provides high-performance algorithm implementations to build visibility graphs from t

Carlos Bergillos 26 Dec 17, 2022
This component provides a wrapper to display SHAP plots in Streamlit.

streamlit-shap This component provides a wrapper to display SHAP plots in Streamlit.

Snehan Kekre 30 Dec 10, 2022
Jupyter Notebook extension leveraging pandas DataFrames by integrating DataTables and ChartJS.

Jupyter DataTables Jupyter Notebook extension to leverage pandas DataFrames by integrating DataTables JS. About Data scientists and in fact many devel

Marek Čermák 142 Dec 28, 2022
YOPO is an interactive dashboard which generates various standard plots.

YOPO is an interactive dashboard which generates various standard plots.you can create various graphs and charts with a click of a button. This tool uses Dash and Flask in backend.

ADARSH C 38 Dec 20, 2022
This repository contains a streaming Dataflow pipeline written in Python with Apache Beam, reading data from PubSub.

Sample streaming Dataflow pipeline written in Python This repository contains a streaming Dataflow pipeline written in Python with Apache Beam, readin

Israel Herraiz 9 Mar 18, 2022
Boltzmann visualization - Visualize the Boltzmann distribution for simple quantum models of molecular motion

Boltzmann visualization - Visualize the Boltzmann distribution for simple quantum models of molecular motion

1 Jan 22, 2022
A Python Binder that merge 2 files with any extension by creating a new python file and compiling it to exe which runs both payloads.

Update ! ANONFILE MIGHT NOT WORK ! About A Python Binder that merge 2 files with any extension by creating a new python file and compiling it to exe w

Vesper 15 Oct 12, 2022
Missing data visualization module for Python.

missingno Messy datasets? Missing values? missingno provides a small toolset of flexible and easy-to-use missing data visualizations and utilities tha

Aleksey Bilogur 3.4k Dec 29, 2022
VDLdraw - Batch plot the log files exported from VisualDL using Matplotlib

VDLdraw Batch plot the log files exported from VisualDL using Matplotlib. At pre

Yizhou Chen 5 Sep 26, 2022