Create 3d loss surface visualizations, with optimizer path. Issues welcome!

Overview

MLVTK PyPI - Python Version PyPI

A loss surface visualization tool

Png

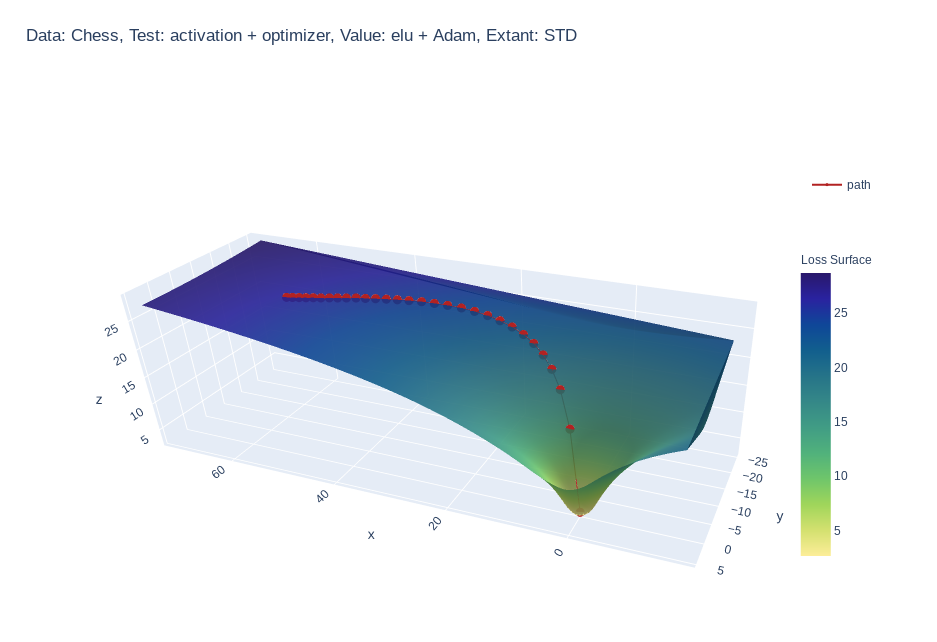
Simple feed-forward network trained on chess data, using elu activation and Adam optimizer


Gif

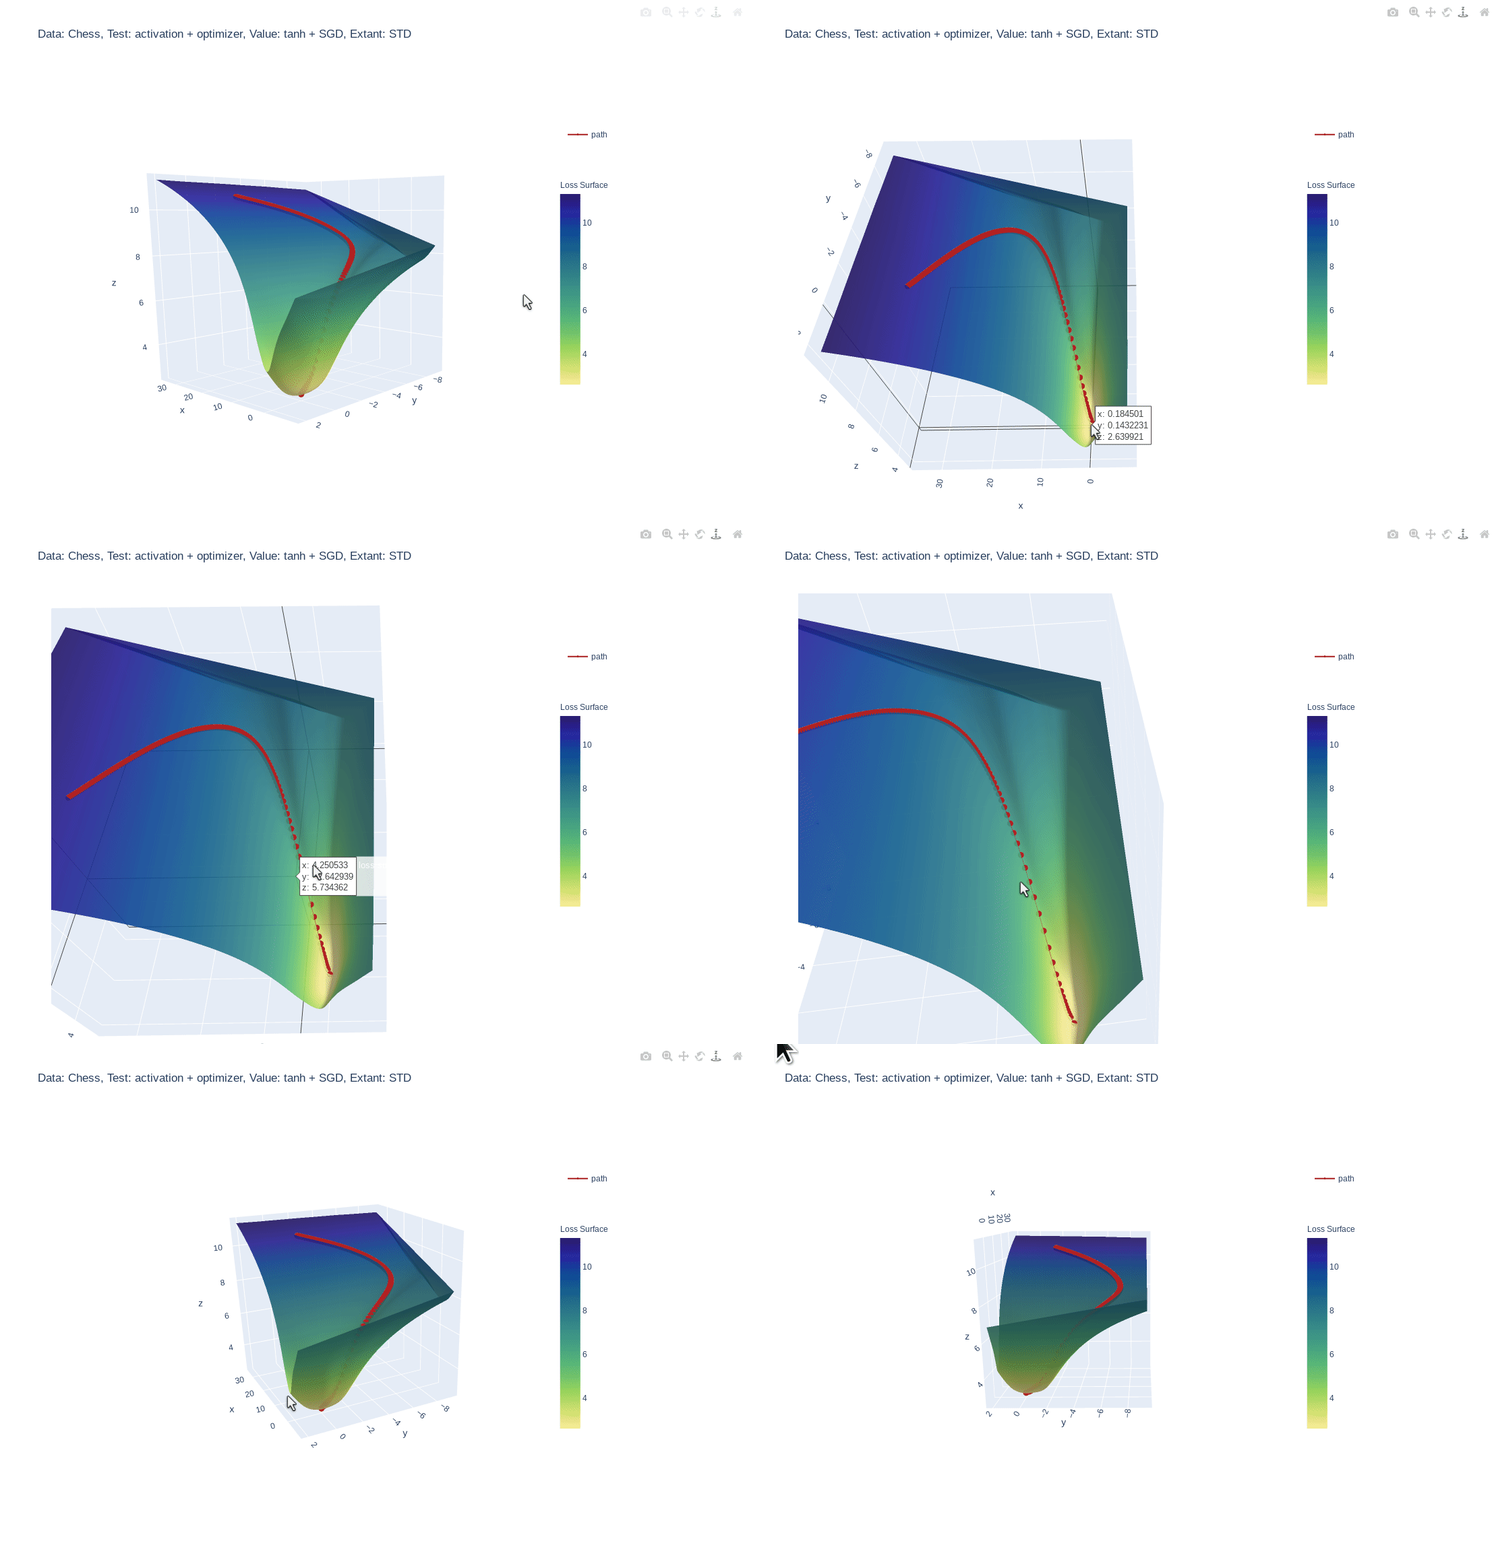
Simple feed-forward network trained on chess data, using tanh activation and SGD optimizer


Gif

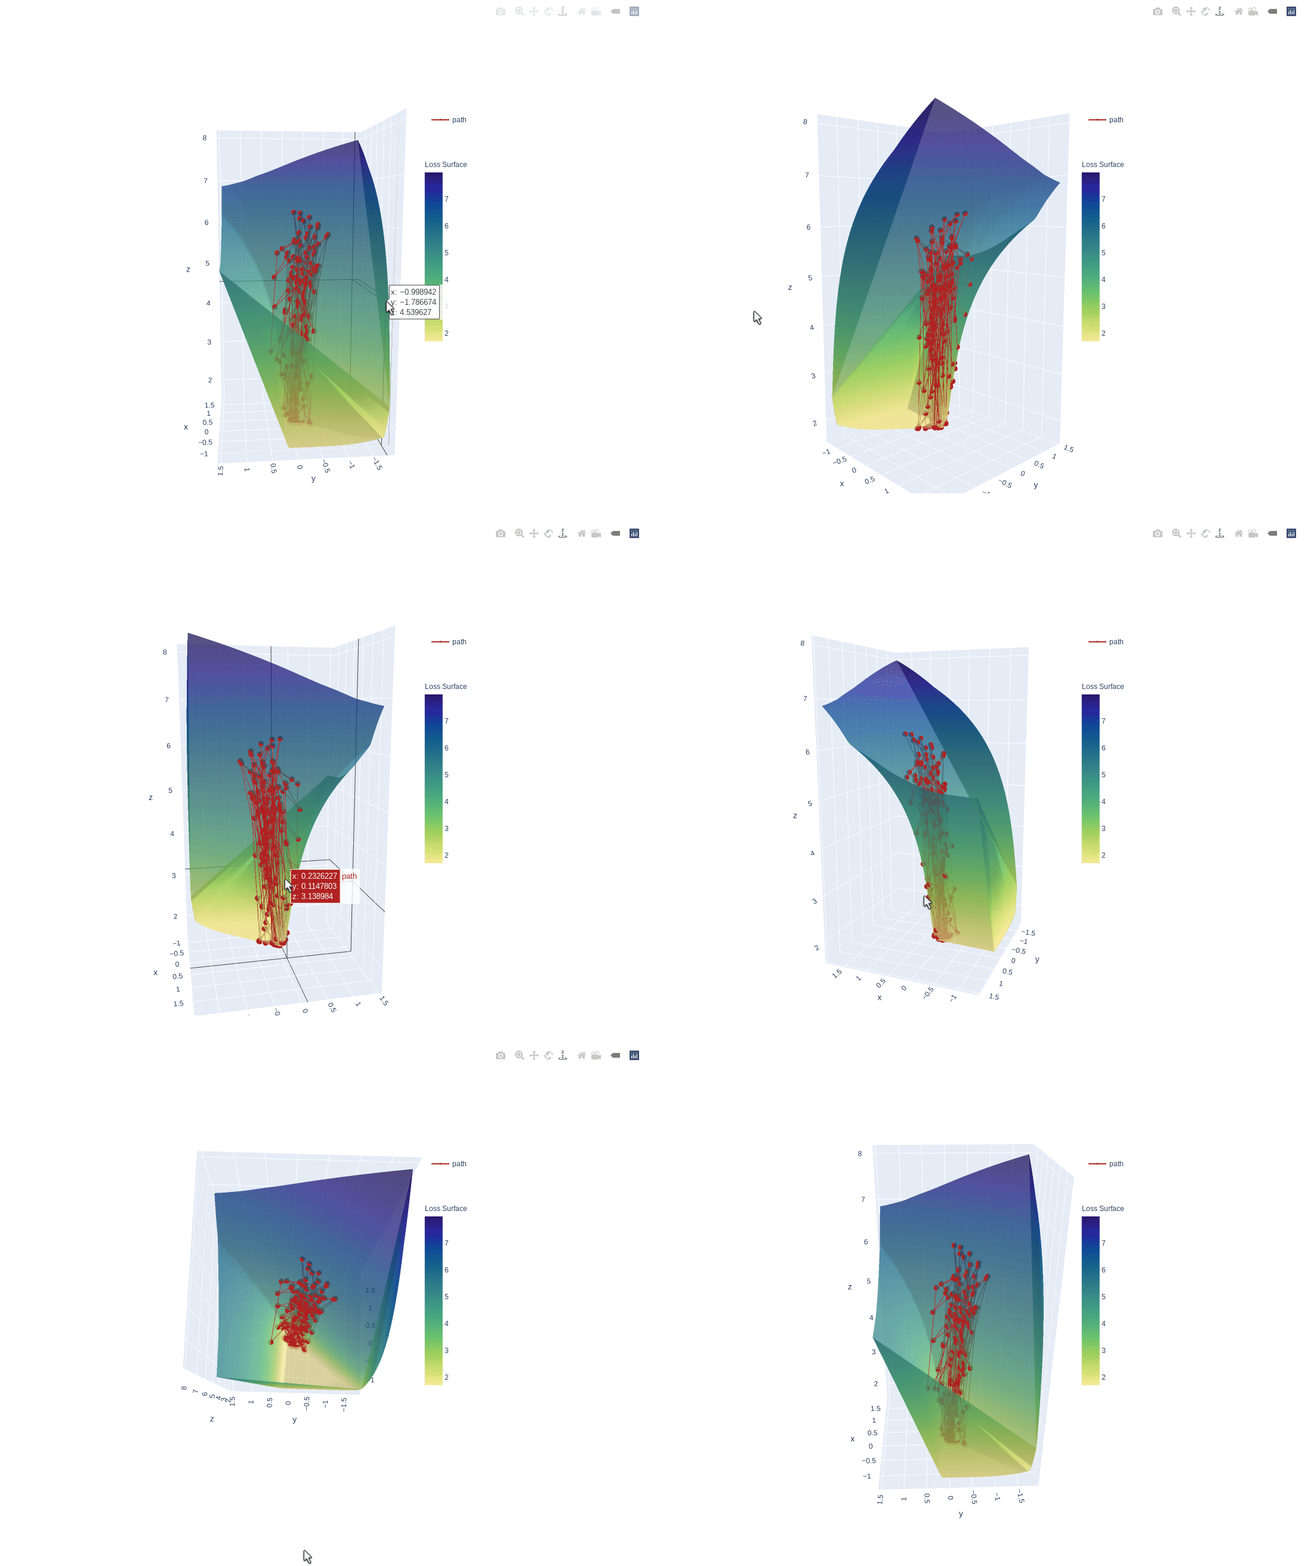
3 layer feed-forward network trained on hand written letters data, using relu activation, SGD optimizer and learning rate of 2.0. Example of what happens to path when learning rate is too high


Gif

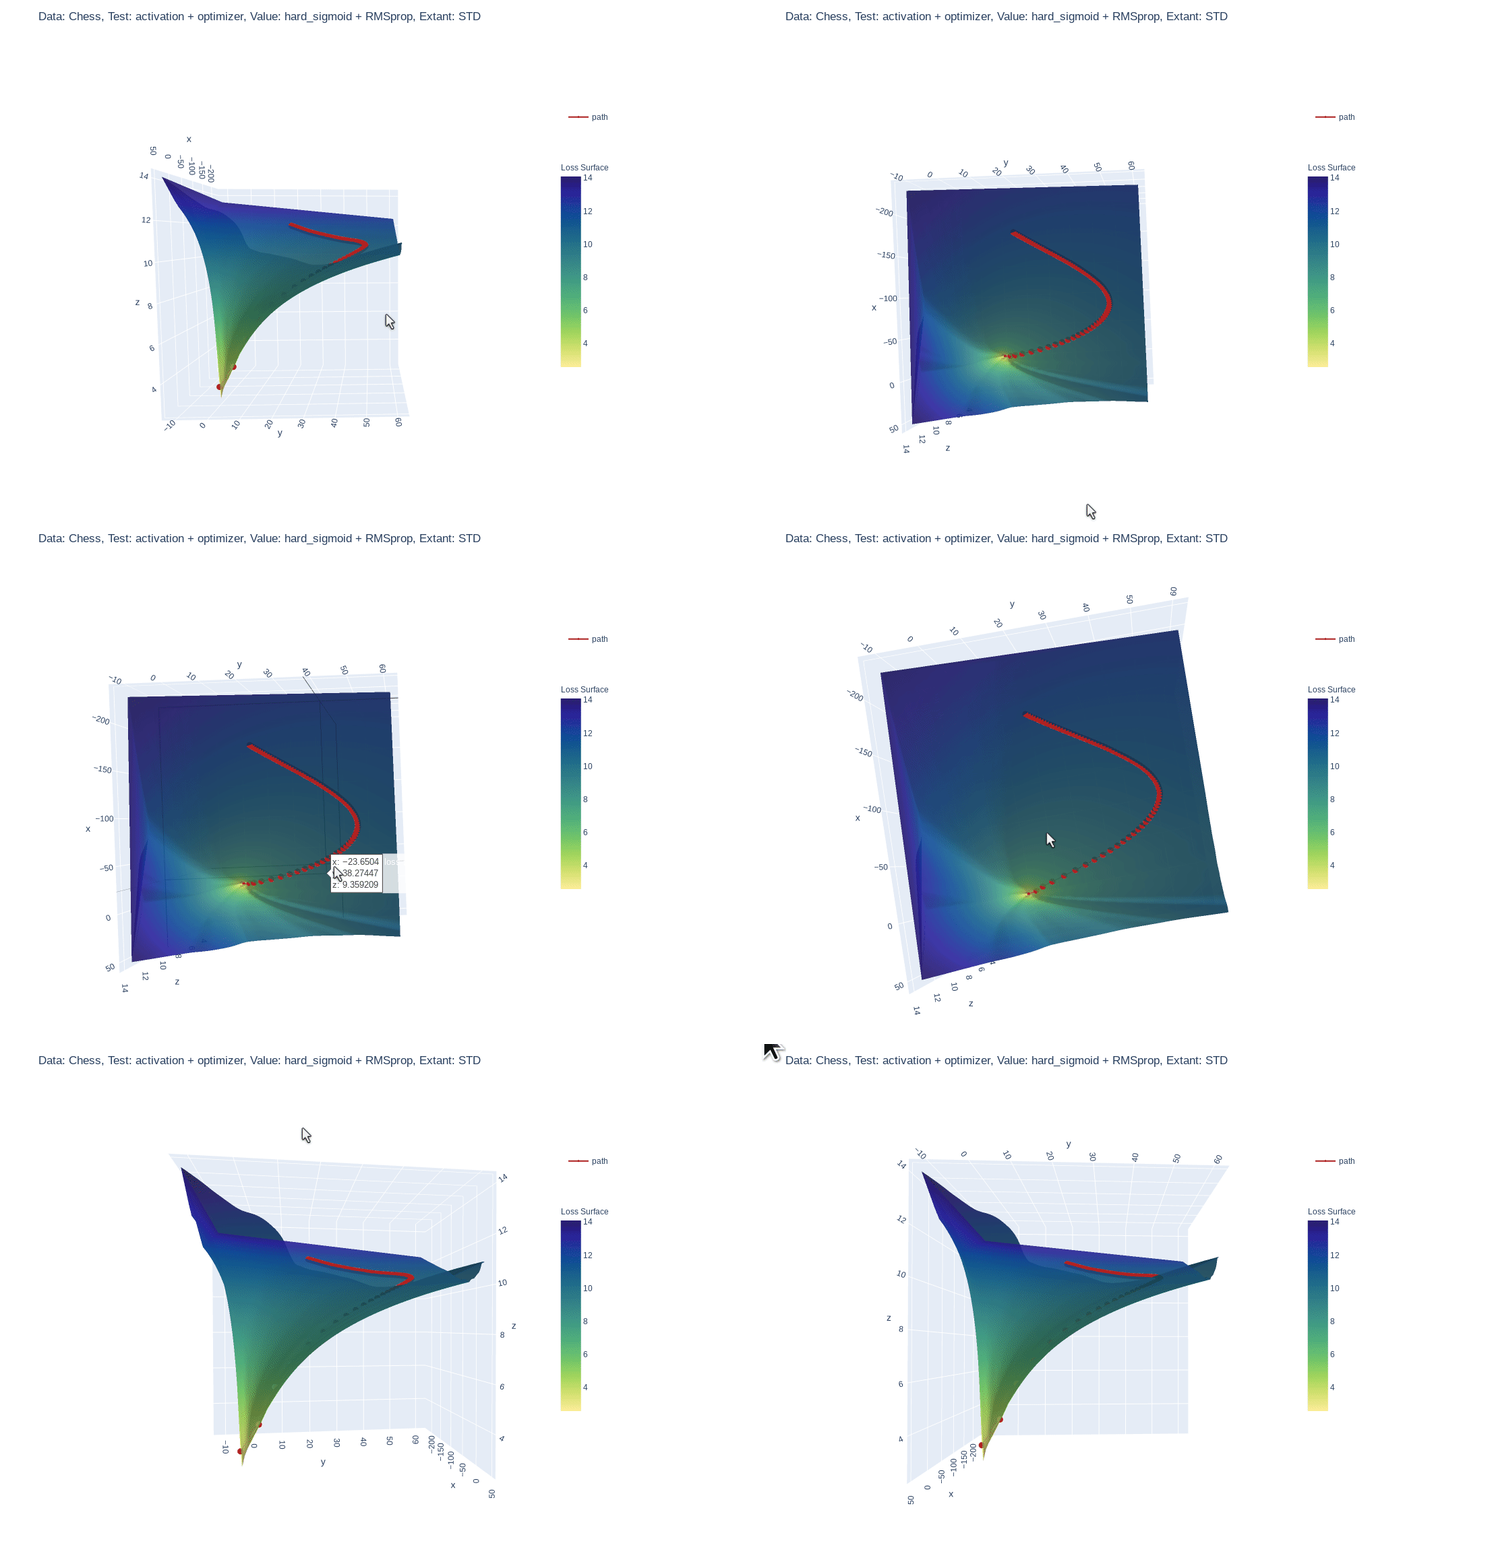
Simple feed-forward network trained on chess data, using hard-sigmoid activation and RMSprop optimizer

Why?

  • :shipit: Simple: A single line addition is all that is needed.
  • Informative: Gain insight into what your model is seeing.
  • 📓 Educational: See how your hyper parameters and architecture impact your models perception.

Quick Start

Requires version
python >= 3.6.1
tensorflow >= 2.3.1
plotly >=4.9.0

Install locally (Also works in google Colab!):

pip install mlvtk

Optionally for use with jupyter notebook/lab:

Notebook

=5.3" "ipywidgets==7.5"">
pip install "notebook>=5.3" "ipywidgets==7.5"

Lab

pip install jupyterlab "ipywidgets==7.5"

# Basic JupyterLab renderer support
jupyter labextension install [email protected]

# OPTIONAL: Jupyter widgets extension for FigureWidget support
jupyter labextension install @jupyter-widgets/jupyterlab-manager [email protected]

Basic Example

from mlvtk.base import Vmodel
import tensorflow as tf
import numpy as np

# NN with 1 hidden layer
inputs = tf.keras.layers.Input(shape=(None,100))
dense_1 = tf.keras.layers.Dense(50, activation='relu')(inputs)
outputs = tf.keras.layers.Dense(10, activation='softmax')(dense_1)
_model = tf.keras.Model(inputs, outputs)

# Wrap with Vmodel
model = Vmodel(_model)
model.compile(optimizer=tf.keras.optimizers.SGD(),
loss=tf.keras.losses.CategoricalCrossentropy(), metrics=['accuracy'])

# All tf.keras.(Model/Sequential/Functional) methods/properties are accessible
# from Vmodel

model.summary()
model.get_config()
model.get_weights()
model.layers

# Create random example data
x = np.random.rand(3, 10, 100)
y = np.random.randint(9, size=(3, 10, 10))
xval = np.random.rand(1, 10, 100)
yval = np.random.randint(9, size=(1,10,10))

# Only difference, model.fit requires validation_data (tf.data.Dataset, or
# other container
history = model.fit(x, y, validation_data=(xval, yval), epochs=10, verbose=0)

# Calling model.surface_plot() returns a plotly.graph_objs.Figure
# model.surface_plot() will attempt to display the figure inline

fig = model.surface_plot()

# fig can save an interactive plot to an html file,
fig.write_html("surface_plot.html")

# or display the plot in jupyter notebook/lab or other compatible tool.
fig.show()
Owner
Research analyst
Visualization ideas for data science

Nuance I use Nuance to curate varied visualization thoughts during my data scientist career. It is not yet a package but a list of small ideas. Welcom

Li Jiangchun 16 Nov 03, 2022
Info for The Great DataTas plot-a-thon

The Great DataTas plot-a-thon Datatas is organising a Data Visualisation competition: The Great DataTas plot-a-thon We will be using Tidy Tuesday data

2 Nov 21, 2021
A little logger for machine learning research

Blinker Blinker provides a fast dispatching system that allows any number of interested parties to subscribe to events, or "signals". Signal receivers

Reinforcement Learning Working Group 27 Dec 03, 2022
Python package for hypergraph analysis and visualization.

The HyperNetX library provides classes and methods for the analysis and visualization of complex network data. HyperNetX uses data structures designed to represent set systems containing nested data

Pacific Northwest National Laboratory 304 Dec 27, 2022
A Python toolbox for gaining geometric insights into high-dimensional data

"To deal with hyper-planes in a 14 dimensional space, visualize a 3D space and say 'fourteen' very loudly. Everyone does it." - Geoff Hinton Overview

Contextual Dynamics Laboratory 1.8k Dec 29, 2022
Smarthome Dashboard with Grafana & InfluxDB

Smarthome Dashboard with Grafana & InfluxDB This is a complete overhaul of my Raspberry Dashboard done with Flask. I switched from sqlite to InfluxDB

6 Oct 20, 2022
Python toolkit for defining+simulating+visualizing+analyzing attractors, dynamical systems, iterated function systems, roulette curves, and more

Attractors A small module that provides functions and classes for very efficient simulation and rendering of iterated function systems; dynamical syst

1 Aug 04, 2021
An open-source plotting library for statistical data.

Lets-Plot Lets-Plot is an open-source plotting library for statistical data. It is implemented using the Kotlin programming language. The design of Le

JetBrains 820 Jan 06, 2023
GD-UltraHack - A Mod Menu for Geometry Dash. Specifically a MegahackV5 clone in Python. Only for Windows

GD UltraHack: The Mod Menu that Nobody asked for. This is a mod menu for the gam

zeo 1 Jan 05, 2022
A python script editor for napari based on PyQode.

napari-script-editor A python script editor for napari based on PyQode. This napari plugin was generated with Cookiecutter using with @napari's cookie

Robert Haase 9 Sep 20, 2022
Easily convert matplotlib plots from Python into interactive Leaflet web maps.

mplleaflet mplleaflet is a Python library that converts a matplotlib plot into a webpage containing a pannable, zoomable Leaflet map. It can also embe

Jacob Wasserman 502 Dec 28, 2022
Minimalistic tool to visualize how the routes to a given target domain change over time, feat. Python 3.10 & mermaid.js

Minimalistic tool to visualize how the routes to a given target domain change over time, feat. Python 3.10 & mermaid.js

Péter Ferenc Gyarmati 1 Jan 17, 2022
Comparing USD and GBP Exchange Rates

Currency Data Visualization Comparing USD and GBP Exchange Rates This is a bar graph comparing GBP and USD exchange rates. I chose blue for the UK bec

5 Oct 28, 2021
3D-Lorenz-Attractor-simulation-with-python

3D-Lorenz-Attractor-simulation-with-python Animação 3D da trajetória do Atrator de Lorenz, implementada em Python usando o método de Runge-Kutta de 4ª

Hevenicio Silva 17 Dec 08, 2022
Data science project for exploratory analysis on the kcse grades dataset (Kamilimu Data Science Track)

Kcse-Data-Analysis Data science project for exploratory analysis on the kcse grades dataset (Kamilimu Data Science Track) Findings The performance of

MUGO BRIAN 1 Feb 23, 2022
Tweets your monthly GitHub Contributions as Wordle grid

Tweets your monthly GitHub Contributions as Wordle grid

Venu Vardhan Reddy Tekula 5 Feb 16, 2022
3D rendered visualization of the austrian monuments registry

Visualization of the Austrian Monuments Visualization of the monument landscape of the austrian monuments registry (Bundesdenkmalamt Denkmalverzeichni

Nikolai Janakiev 3 Oct 24, 2019
A Jupyter - Leaflet.js bridge

ipyleaflet A Jupyter / Leaflet bridge enabling interactive maps in the Jupyter notebook. Usage Selecting a basemap for a leaflet map: Loading a geojso

Jupyter Widgets 1.3k Dec 27, 2022
A blender import/export system for Defold

defold-blender-export A Blender export system for the Defold game engine. Setup Notes There are no exhaustive documents for this tool yet. Its just no

David Lannan 27 Dec 30, 2022
Custom Plotly Dash components based on Mantine React Components library

Dash Mantine Components Dash Mantine Components is a Dash component library based on Mantine React Components Library. It makes it easier to create go

Snehil Vijay 239 Jan 08, 2023