Colormaps for astronomers

Overview

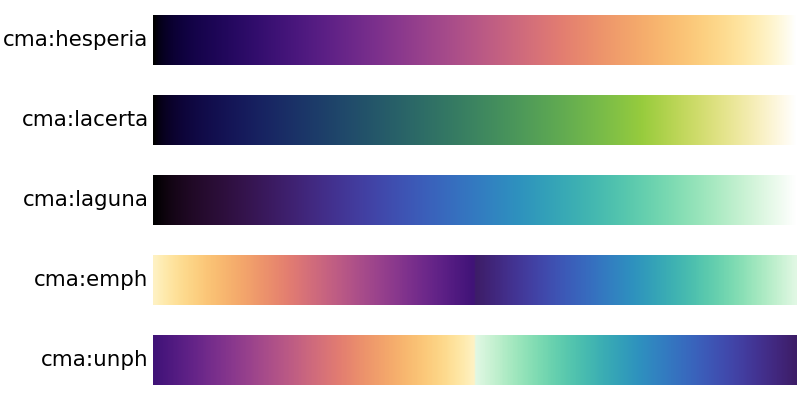
cmastro: colormaps for astronomers 🔭

Documentation Status

This package contains custom colormaps that have been used in various astronomical applications, similar to cmocean for oceanography. The colormaps are available as raw data files through the GitHub source repository, or available to use (through this Python package) as matplotlib colormaps.

cmaps

Also check out these other awesome colormap or color palette projects:

Installation

PyPI

cmastro is available via pip, which is the recommended installation method. To install the latest stable version using pip, use:

python -m pip install cmastro

To install the latest development version:

python -m pip install git+https://github.com/adrn/cmastro

License

License

cmastro is free software made available under the MIT License. For details see the LICENSE file. Copyright 2021 the contributors.

Owner
Adrian Price-Whelan
Adrian Price-Whelan
ipyvizzu - Jupyter notebook integration of Vizzu

ipyvizzu - Jupyter notebook integration of Vizzu. Tutorial · Examples · Repository About The Project ipyvizzu is the Jupyter Notebook integration of V

Vizzu 729 Jan 08, 2023
Parallel t-SNE implementation with Python and Torch wrappers.

Multicore t-SNE This is a multicore modification of Barnes-Hut t-SNE by L. Van der Maaten with python and Torch CFFI-based wrappers. This code also wo

Dmitry Ulyanov 1.7k Jan 09, 2023
Create HTML profiling reports from pandas DataFrame objects

Pandas Profiling Documentation | Slack | Stack Overflow Generates profile reports from a pandas DataFrame. The pandas df.describe() function is great

10k Jan 01, 2023
`charts.css.py` brings `charts.css` to Python. Online documentation and samples is available at the link below.

charts.css.py charts.css.py provides a python API to convert your 2-dimension data lists into html snippet, which will be rendered into charts by CSS,

Ray Luo 3 Sep 23, 2021
D-Analyst : High Performance Visualization Tool

D-Analyst : High Performance Visualization Tool D-Analyst is a high performance data visualization built with python and based on OpenGL. It allows to

4 Apr 14, 2022
Time series visualizer is a flexible extension that provides filling world map by country from real data.

Time-series-visualizer Time series visualizer is a flexible extension that provides filling world map by country from csv or json file. You can know d

Long Ng 3 Jul 09, 2021
An interactive dashboard built with python that enables you to visualise how rent prices differ across Sweden.

sweden-rent-dashboard An interactive dashboard built with python that enables you to visualise how rent prices differ across Sweden. The dashboard/web

Rory Crean 5 Dec 19, 2021
Tidy data structures, summaries, and visualisations for missing data

naniar naniar provides principled, tidy ways to summarise, visualise, and manipulate missing data with minimal deviations from the workflows in ggplot

Nicholas Tierney 611 Dec 22, 2022
Main repository for Vispy

VisPy: interactive scientific visualization in Python Main website: http://vispy.org VisPy is a high-performance interactive 2D/3D data visualization

vispy 3k Jan 03, 2023
CompleX Group Interactions (XGI) provides an ecosystem for the analysis and representation of complex systems with group interactions.

XGI CompleX Group Interactions (XGI) is a Python package for the representation, manipulation, and study of the structure, dynamics, and functions of

Complex Group Interactions 67 Dec 28, 2022
Statistics and Visualization of acceptance rate, main keyword of CVPR 2021 accepted papers for the main Computer Vision conference (CVPR)

Statistics and Visualization of acceptance rate, main keyword of CVPR 2021 accepted papers for the main Computer Vision conference (CVPR)

Hoseong Lee 78 Aug 23, 2022
Python support for Godot 🐍🐍🐍

Godot Python, because you want Python on Godot ! The goal of this project is to provide Python language support as a scripting module for the Godot ga

Emmanuel Leblond 1.4k Jan 04, 2023
Exploratory analysis and data visualization of aircraft accidents and incidents in Brazil.

Exploring aircraft accidents in Brazil Occurrencies with aircraft in Brazil are investigated by the Center for Investigation and Prevention of Aircraf

Augusto Herrmann 5 Dec 14, 2021
Color maps for POV-Ray v3.7 from the Plasma, Inferno, Magma and Viridis color maps in Python's Matplotlib

POV-Ray-color-maps Color maps for POV-Ray v3.7 from the Plasma, Inferno, Magma and Viridis color maps in Python's Matplotlib. The include file Color_M

Tor Olav Kristensen 1 Apr 05, 2022
An application that allows you to design and test your own stock trading algorithms in an attempt to beat the market.

StockBot is a Python application for designing and testing your own daily stock trading algorithms. Installation Use the

Ryan Cullen 280 Dec 19, 2022
Visualize the training curve from the *.csv file (tensorboard format).

Training-Curve-Vis Visualize the training curve from the *.csv file (tensorboard format). Feature Custom labels Curve smoothing Support for multiple c

Luckky 7 Feb 23, 2022
Getting started with Python, Dash and Plot.ly for the Data Dashboards team

data_dashboards Getting started with Python, Dash and Plot.ly for the Data Dashboards team Getting started MacOS users: # Install the pyenv version ma

Department for Levelling Up, Housing and Communities 1 Nov 08, 2021
Create matplotlib visualizations from the command-line

MatplotCLI Create matplotlib visualizations from the command-line MatplotCLI is a simple utility to quickly create plots from the command-line, levera

Daniel Moura 46 Dec 16, 2022
An open-source plotting library for statistical data.

Lets-Plot Lets-Plot is an open-source plotting library for statistical data. It is implemented using the Kotlin programming language. The design of Le

JetBrains 820 Jan 06, 2023