Convert tables stored as images to an usable .csv file

Overview

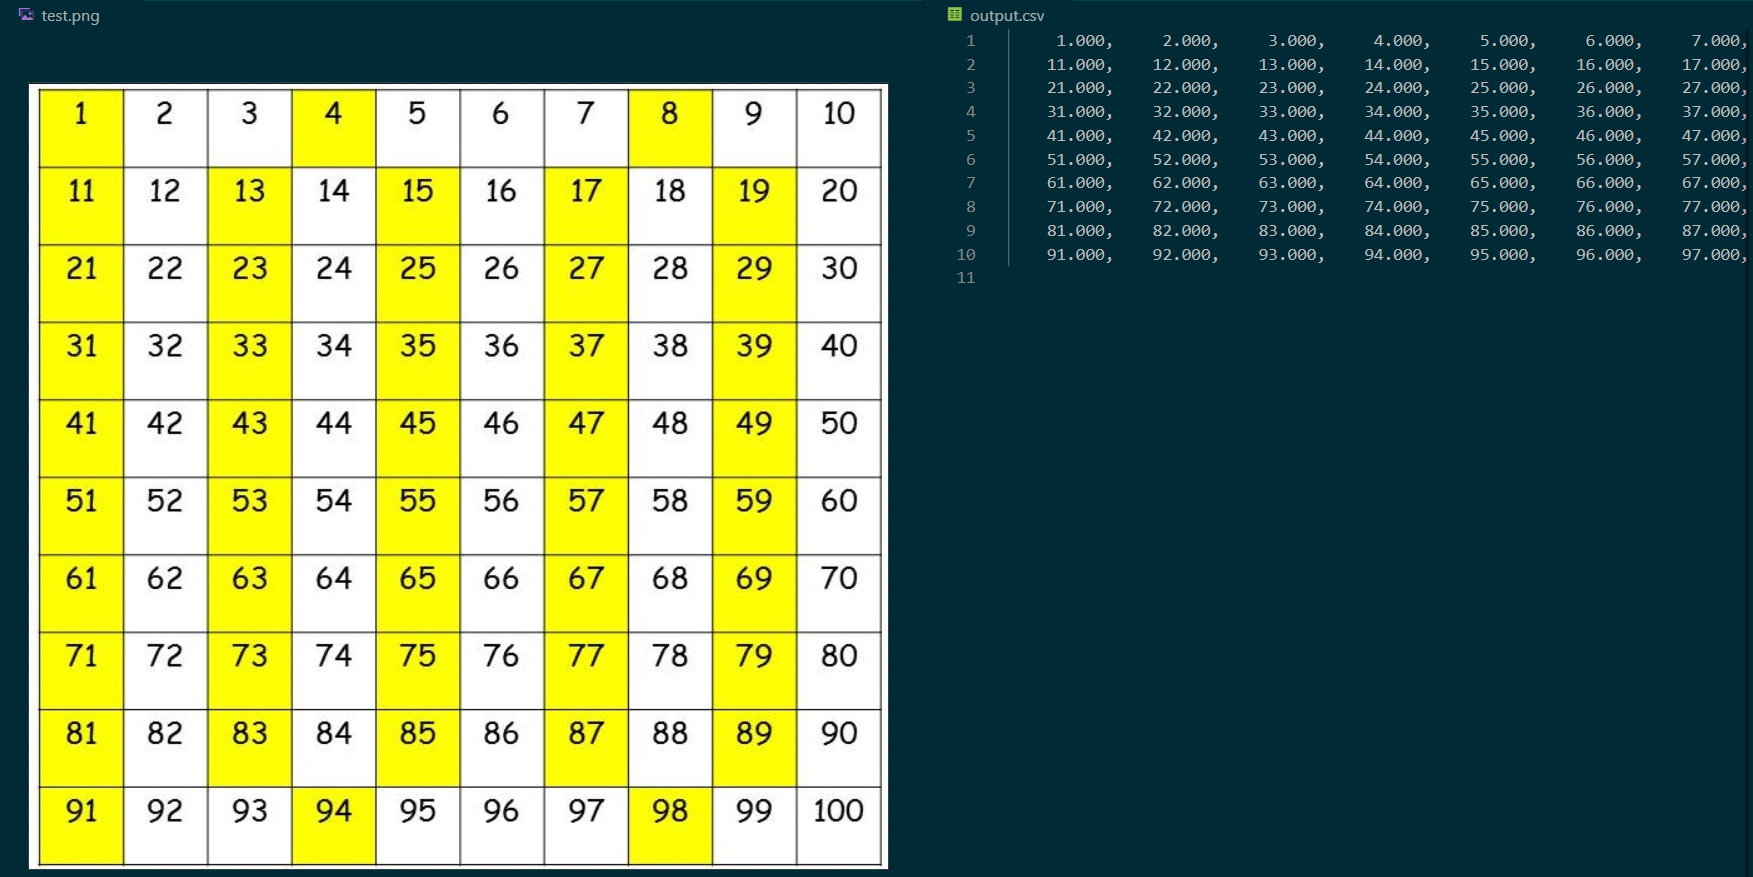
Convert an image of numbers to a .csv file

This Python program aims to convert images of array numbers to corresponding .csv files. It uses OpenCV for Python to process the given image and Tesseract for number recognition.

Output Example

The repository includes:

  • the source code of image2csv.py,
  • the tools.py file where useful functions are implemented,
  • the grid_detector.py file to perform automatic grid detection,
  • a folder with some files used for test.

The code is not well documented nor fully efficient as I'm a beginner in programming, and this project is a way for me to improve my skills, in particular in Python programming.

How to use the program

First of all, the user must install the needed packages:

$ pip install -r requirements.txt   

as well as Tesseract.

Then, in a python terminal, use the command line:

$ python image2csv.py --image path/to/image

There are a few optionnal arguments:

  • --path path/to/output/csv/file
  • --grid [False]/True
  • --visualization [y]/n
  • --method [fast]/denoize

and one can find their usage using the command line:

$ python image2csv.py --help

By default, the program will try to detect a grid automatically. This detection uses OpenCV's Hough transformation and Canny detection, so the user can tweak a few parameters for better processing in the grid_detector.py file.

When then program is running with manual grid detection, the user has to interact with it via its mouse and the terminal :

  1. the image is opened in a window for the user to draw a rectangle around the first (top left) number. As this rectangle is used as a base to create a grid afterward, keep in mind that all the numbers should fit into the box.
  2. A new window is opened showing the image with the drawn rectangle. Press any key to close and continue.
  3. Based on the drawn rectangle, a grid is created to extract each number one by one. This grid is controlled by the user via two "offset" values. The user has to enter those values in the terminal, then the image is opened in a window with the created grid. Press any key to close and continue. If the numbers does not fit into the grid, the user can change the offset values and repeat this step. When the grid matches the user's expectations, he can set both of the offset values to 0 to continue.
  4. The numbers are extracted from the image and the results are shown in the terminal. (be carefoul though, the indicated number of errors represents the number of errors encountered by Tesseract, but Tesseract can identify a wrong number which will not be counted as an error !)
  5. The .csv file is created with the numbers identified by Tesseract. If Tesseract finds an error, it will show up on the .csv file as an infinite value.

Hypothesis and limits

For the program to run correctly, the input image must verify some hypothesis (just a few simple ones):

  • for manual selection, the line and row width must be constants, as the build grid is just a repetition of the initial rectangle with offsets;
  • to use automatic grid detection, a full and clear grid, with external borders, must be visible;
  • it is recommended to have a good input image resolution, to control the offsets more easily.

At last, this program is not perfect (I know you thought so, with its smooth workflow and simple hypothesis, sorry to disappoint...) and does not work with decimal numbers... But does a great job on negatives ! Also the user must be careful with the slashed zero which seems to be identified by Tesseract as a six.

Credits

For image pre-processing in the tool.py file I used a useful function implemented by @Nitish9711 for his Automatic-Number-plate-detection (https://github.com/Nitish9711/Automatic-Number-plate-detection.git).

Owner
Beginning in the programming world with the help of @29jm, holy builder of the very special SnowflakeOS. Student at the École Centrale de Lille (FR).
Pandas and Dask test helper methods with beautiful error messages.

beavis Pandas and Dask test helper methods with beautiful error messages. test helpers These test helper methods are meant to be used in test suites.

Matthew Powers 18 Nov 28, 2022
Open-Domain Question-Answering for COVID-19 and Other Emergent Domains

Open-Domain Question-Answering for COVID-19 and Other Emergent Domains This repository contains the source code for an end-to-end open-domain question

7 Sep 27, 2022
Analytical view of olist e-commerce in Brazil

Analysis of E-Commerce Public Dataset by Olist The objective of this project is to propose an analytical view of olist e-commerce in Brazil. For this

Gurpreet Singh 1 Jan 11, 2022
Project under the certification "Data Analysis with Python" on FreeCodeCamp

Sea Level Predictor Assignment You will anaylize a dataset of the global average sea level change since 1880. You will use the data to predict the sea

Bhavya Gopal 3 Jan 31, 2022
A project consists in a set of assignements corresponding to a BI process: data integration, construction of an OLAP cube, qurying of a OPLAP cube and reporting.

TennisBusinessIntelligenceProject - A project consists in a set of assignements corresponding to a BI process: data integration, construction of an OLAP cube, qurying of a OPLAP cube and reporting.

carlo paladino 1 Jan 02, 2022
Analyse the limit order book in seconds. Zoom to tick level or get yourself an overview of the trading day.

Analyse the limit order book in seconds. Zoom to tick level or get yourself an overview of the trading day. Correlate the market activity with the Apple Keynote presentations.

2 Jan 04, 2022
This repo contains a simple but effective tool made using python which can be used for quality control in statistical approach.

This repo contains a powerful tool made using python which is used to visualize, analyse and finally assess the quality of the product depending upon the given observations

SasiVatsal 8 Oct 18, 2022
A powerful data analysis package based on mathematical step functions. Strongly aligned with pandas.

The leading use-case for the staircase package is for the creation and analysis of step functions. Pretty exciting huh. But don't hit the close button

48 Dec 21, 2022
songplays datamart provide details about the musical taste of our customers and can help us to improve our recomendation system

Songplays User activity datamart The following document describes the model used to build the songplays datamart table and the respective ETL process.

Leandro Kellermann de Oliveira 1 Jul 13, 2021
First steps with Python in Life Sciences

First steps with Python in Life Sciences This course material is part of the "First Steps with Python in Life Science" three-day course of SIB-trainin

SIB Swiss Institute of Bioinformatics 22 Jan 08, 2023
Visions provides an extensible suite of tools to support common data analysis operations

Visions And these visions of data types, they kept us up past the dawn. Visions provides an extensible suite of tools to support common data analysis

168 Dec 28, 2022
INFO-H515 - Big Data Scalable Analytics

INFO-H515 - Big Data Scalable Analytics Jacopo De Stefani, Giovanni Buroni, Théo Verhelst and Gianluca Bontempi - Machine Learning Group Exercise clas

Yann-Aël Le Borgne 58 Dec 11, 2022
Python package for processing UC module spectral data.

UC Module Python Package How To Install clone repo. cd UC-module pip install . How to Use uc.module.UC(measurment=str, dark=str, reference=str, heade

Nicolai Haaber Junge 1 Oct 20, 2021
Create HTML profiling reports from pandas DataFrame objects

Pandas Profiling Documentation | Slack | Stack Overflow Generates profile reports from a pandas DataFrame. The pandas df.describe() function is great

10k Jan 01, 2023
Big Data & Cloud Computing for Oceanography

DS2 Class 2022, Big Data & Cloud Computing for Oceanography Home of the 2022 ISblue Big Data & Cloud Computing for Oceanography class (IMT-A, ENSTA, I

Ocean's Big Data Mining 5 Mar 19, 2022
My first Python project is a simple Mad Libs program.

Python CLI Mad Libs Game My first Python project is a simple Mad Libs program. Mad Libs is a phrasal template word game created by Leonard Stern and R

Carson Johnson 1 Dec 10, 2021
A set of procedures that can realize covid19 virus detection based on blood.

A set of procedures that can realize covid19 virus detection based on blood.

Nuyoah-xlh 3 Mar 07, 2022
Convert monolithic Jupyter notebooks into Ploomber pipelines.

Soorgeon Join our community | Newsletter | Contact us | Blog | Website | YouTube Convert monolithic Jupyter notebooks into Ploomber pipelines. soorgeo

Ploomber 65 Dec 16, 2022
Fit models to your data in Python with Sherpa.

Table of Contents Sherpa License How To Install Sherpa Using Anaconda Using pip Building from source History Release History Sherpa Sherpa is a modeli

134 Jan 07, 2023