Functions for easily making publication-quality figures with matplotlib.

Overview

Data-viz utils ๐Ÿ“ˆ

Functions for data visualization in matplotlib

๐Ÿ“š API

Can be installed using pip install dvu and then imported with import dvu.

You can also just copy the relatively short source code for the functions (easily viewable here).

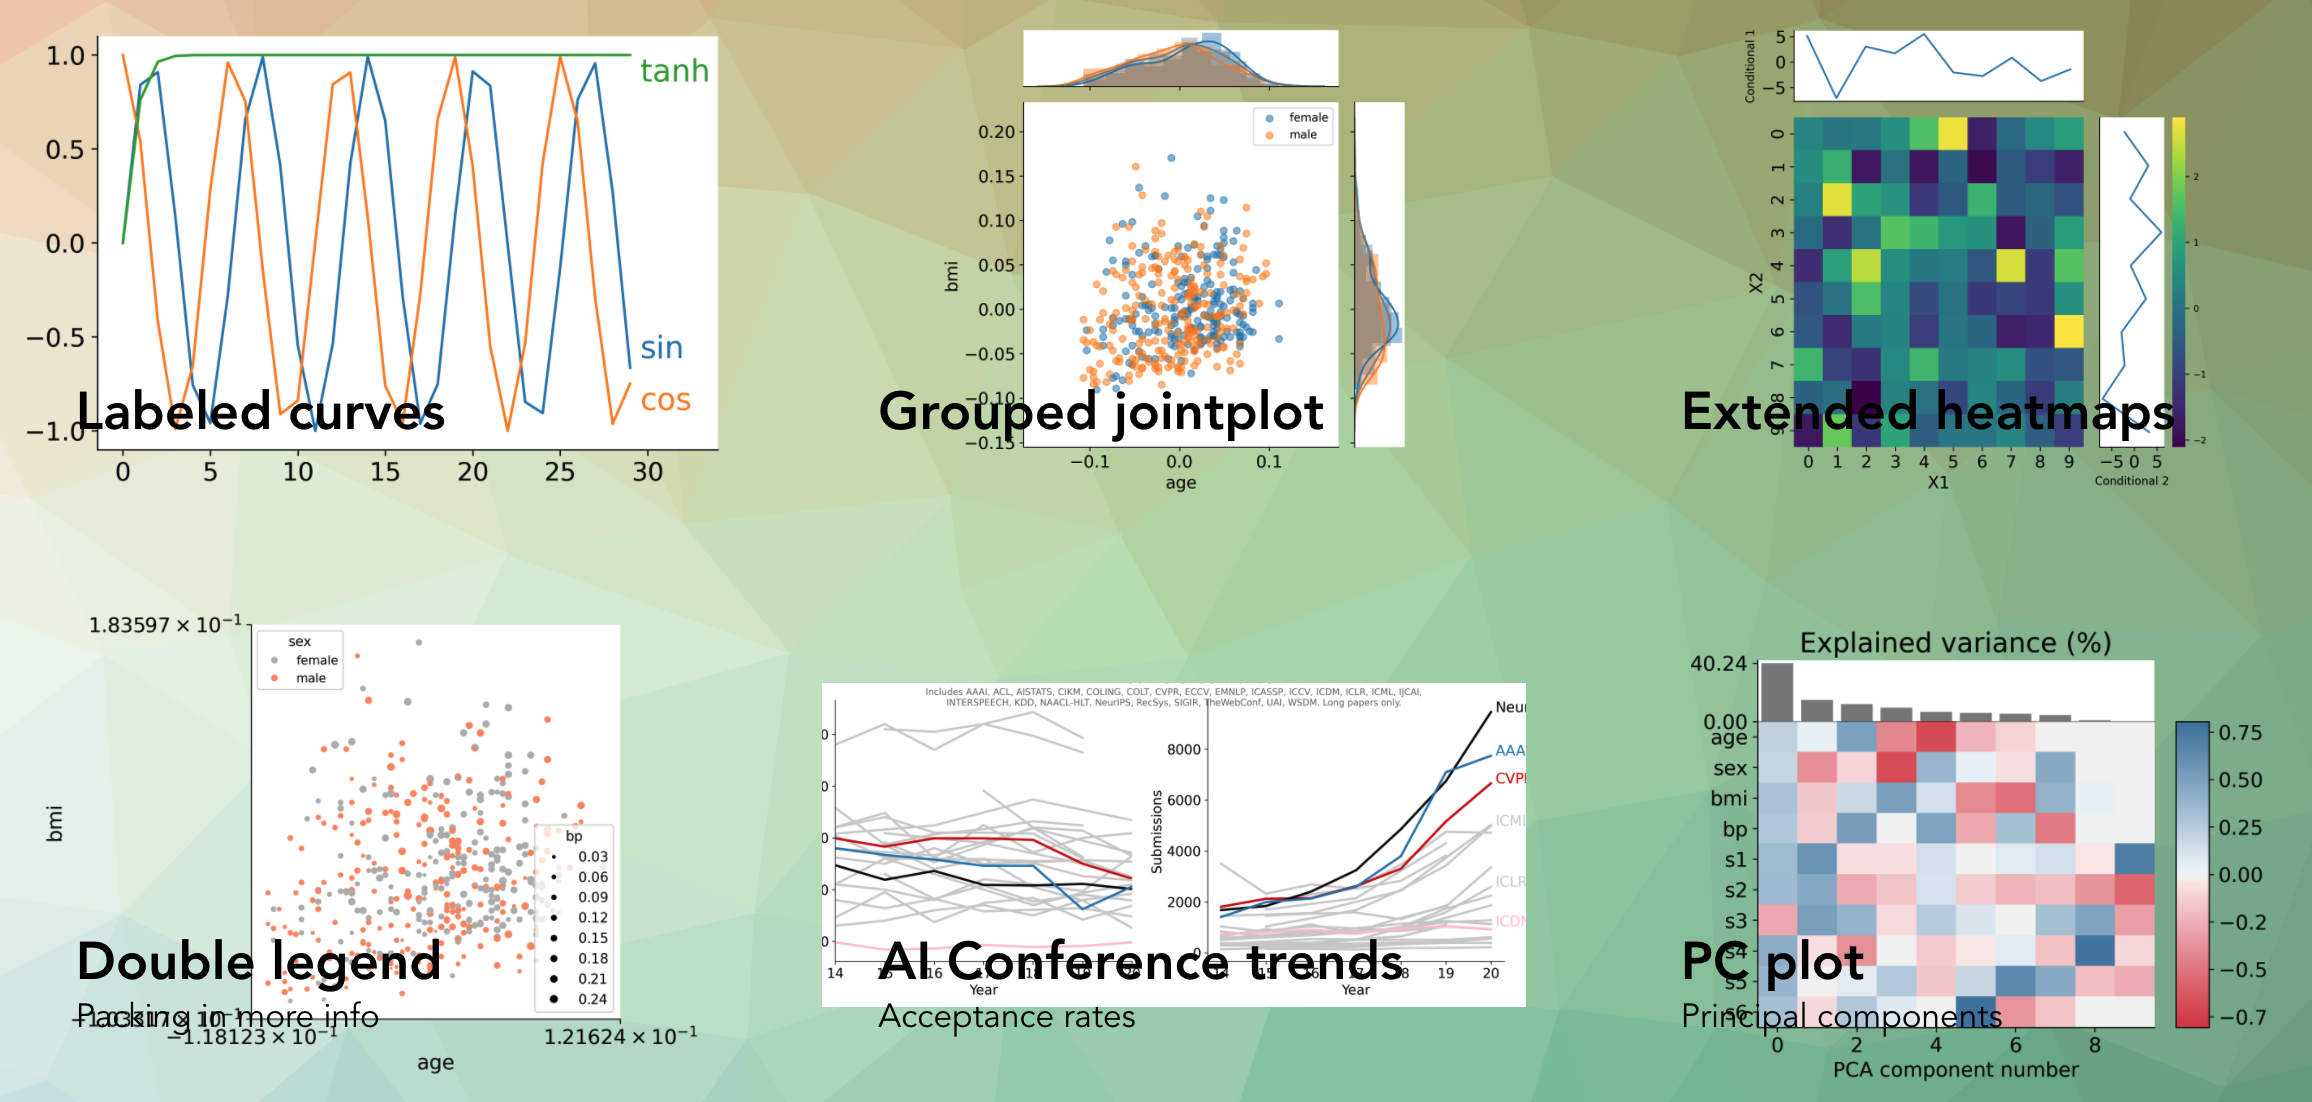
Helps create a bunch of different plots such as these:

One particularly useful function is dvu.line_legend() which replaces a typical matplotlib legend with labels for each line:

Using plt.legend() Using dvu.line_legend()
plt_legend dvu_legend

Another one is dvu.invert_plot() which can be called after generating a plot to invert everything besides the line colors

Original plot After dvu.invert_plot()
plt_legend dvu_legend

Reference

Owner
Chandan Singh
Working on interpretable machine learning across domains ๐Ÿง โš•๏ธ๐Ÿฆ  Let's do good with models.
Chandan Singh
kyle's vision of how datadog's python client should look

kyle's datadog python vision/proposal not for production use See examples/comprehensive.py for a mostly working example of the proposed API. ๐Ÿ“ˆ ๐Ÿถ โค๏ธ

Kyle Verhoog 2 Nov 21, 2021
Rick and Morty Data Visualization with python

Rick and Morty Data Visualization For this project I looked at data for the TV show Rick and Morty Number of Episodes at a Certain Location Here is th

7 Aug 29, 2022
Multi-class confusion matrix library in Python

Table of contents Overview Installation Usage Document Try PyCM in Your Browser Issues & Bug Reports Todo Outputs Dependencies Contribution References

Sepand Haghighi 1.3k Dec 31, 2022
This is a Cross-Platform Plot Manager for Chia Plotting that is simple, easy-to-use, and reliable.

Swar's Chia Plot Manager A plot manager for Chia plotting: https://www.chia.net/ Development Version: v0.0.1 This is a cross-platform Chia Plot Manage

Swar Patel 1.3k Dec 13, 2022
A TileDB backend for xarray.

TileDB-xarray This library provides a backend engine to xarray using the TileDB Storage Engine. Example usage: import xarray as xr dataset = xr.open_d

TileDB, Inc. 14 Jun 02, 2021
Alternative layout visualizer for ZSA Moonlander keyboard

General info This is a keyboard layout visualizer for ZSA Moonlander keyboard (because I didn't find their Oryx or their training tool particularly us

10 Jul 19, 2022
Python Data. Leaflet.js Maps.

folium Python Data, Leaflet.js Maps folium builds on the data wrangling strengths of the Python ecosystem and the mapping strengths of the Leaflet.js

6k Jan 02, 2023
A shimmer pre-load component for Plotly Dash

dash-loading-shimmer A shimmer pre-load component for Plotly Dash Installation Get it with pip: pip install dash-loading-extras Or maybe you prefer Pi

Lucas Durand 4 Oct 12, 2022
Python Data Validation for Humansโ„ข.

validators Python data validation for Humans. Python has all kinds of data validation tools, but every one of them seems to require defining a schema

Konsta Vesterinen 670 Jan 09, 2023
Tools for calculating and visualizing Elo-like ratings of MLB teams using Retosheet data

Overview This project uses historical baseball games data to calculate an Elo-like rating for MLB teams based on regular season match ups. The Elo rat

Lukas Owens 0 Aug 25, 2021
A gui application to visualize various sorting algorithms using pure python.

Sorting Algorithm Visualizer A gui application to visualize various sorting algorithms using pure python. Language : Python 3 Libraries required Tkint

Rajarshi Banerjee 19 Nov 30, 2022
Project coded in Python using Pandas to look at changes in chase% for batters facing a pitcher first time through the order vs. thrid time

Project coded in Python using Pandas to look at changes in chase% for batters facing a pitcher first time through the order vs. thrid time

Jason Kraynak 1 Jan 07, 2022
Official Matplotlib cheat sheets

Official Matplotlib cheat sheets

Matplotlib Developers 6.7k Jan 09, 2023
3D rendered visualization of the austrian monuments registry

Visualization of the Austrian Monuments Visualization of the monument landscape of the austrian monuments registry (Bundesdenkmalamt Denkmalverzeichni

Nikolai Janakiev 3 Oct 24, 2019
China and India Population and GDP Visualization

China and India Population and GDP Visualization Historical Population Comparison between India and China This graph shows the population data of Indi

Nicolas De Mello 10 Oct 27, 2021
Plotting data from the landroid and a raspberry pi zero to a influx-db

landroid-pi-influx Plotting data from the landroid and a raspberry pi zero to a influx-db Dependancies Hardware: Landroid WR130E Raspberry Pi Zero Wif

2 Oct 22, 2021
CLAHE Contrast Limited Adaptive Histogram Equalization

A simple code to process images using contrast limited adaptive histogram equalization. Image processing is becoming a major part of data processig.

Happy N. Monday 4 May 18, 2022
Open-questions - Open questions for Bellingcat technical contributors

Open questions for Bellingcat technical contributors These are difficult, long-term projects that would contribute to open source investigations at Be

Bellingcat 234 Dec 31, 2022
Boltzmann visualization - Visualize the Boltzmann distribution for simple quantum models of molecular motion

Boltzmann visualization - Visualize the Boltzmann distribution for simple quantum models of molecular motion

1 Jan 22, 2022
demir.ai Dataset Operations

demir.ai Dataset Operations With this application, you can have the empty values (nan/null) deleted or filled before giving your dataset to machine le

Ahmet Furkan DEMIR 8 Nov 01, 2022