A simple agent-based model used to teach the basics of OOP in my lectures

Overview

Pydemic

A simple agent-based model of a pandemic.

This is used to teach basic principles of object-oriented programming to master students.

It is not at all optimized for performance and does not have any predictive skill.

Based on an original idea by Georg Wohlfahrt.

image

Rules

We are simulating a square 2-dimensional (nx x nx pixel) domain which is populated by a maximum number of agents (na), i.e. human individuals. The initial position of the agents on the domain is determined with a pseudo-random number generator. Two or more agents may populate the same pixel.

The simulation runs to a maximum of nt time steps. During every time step each agent may move a maximum number of pixels in the horizontal (x) and vertical (y) direction, as determined by the movemax parameter. If movemax = 2, this means that agents may move between -2 and +2 pixels in the x/y-direction – the actual number of moves within these limits is again determined with the random number generator.

If the random moves would cause an agent to leave the domain, the agent is perfectly “reflected” into the domain, i.e. if a random move would bring an agent to the position nx + 2, the position is corrected to nx – 2.

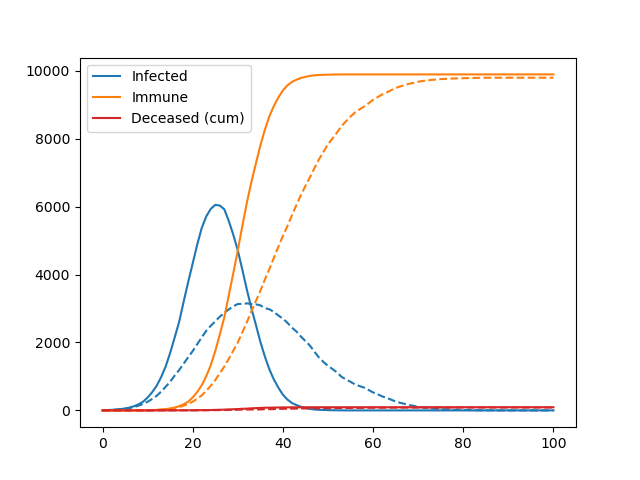
At the start of the simulation, a number n_initial_infected of randomly selected agents carries the virus.

If two or more agents meet on the same pixel and at least one of them is infected there is a certain probability (probability_of_infection) that non-infected, non-immune agents become infected. This dice roll is repeated for each infected agent at this location.

If infected, agents remain infectious until they recover (time_until_recovery). At the end of the infection period, there is also some probability that agents do not recover, but instead decease (mortality_rate), which reduces the total number of agents on the domain. After recovery, the past infection conveys immunity from another infection.

Potential improvements

There are many. See exercises on the topic.

Getting started

Download the code and run pydemic.py in the terminal or in the ipython interpreter.

TODO Fabien

  • Write tests.
  • Add a visualisation of the spatial domain (with density plots or similar).
Owner
Fabien Maussion
Climate, glaciers, and programming.
Fabien Maussion
The Python ensemble sampling toolkit for affine-invariant MCMC

emcee The Python ensemble sampling toolkit for affine-invariant MCMC emcee is a stable, well tested Python implementation of the affine-invariant ense

Dan Foreman-Mackey 1.3k Jan 04, 2023
A tool to plot and execute Rossmos's Formula, that helps to catch serial criminals using mathematics

Rossmo Plotter A tool to plot and execute Rossmos's Formula using python, that helps to catch serial criminals using mathematics Author: Amlan Saha Ku

Amlan Saha Kundu 3 Aug 29, 2022
Painlessly create beautiful matplotlib plots.

Announcement Thank you to everyone who has used prettyplotlib and made it what it is today! Unfortunately, I no longer have the bandwidth to maintain

Olga Botvinnik 1.6k Jan 06, 2023
Fastest Gephi's ForceAtlas2 graph layout algorithm implemented for Python and NetworkX

ForceAtlas2 for Python A port of Gephi's Force Atlas 2 layout algorithm to Python 2 and Python 3 (with a wrapper for NetworkX and igraph). This is the

Bhargav Chippada 227 Jan 05, 2023
Python script for writing text on github contribution chart.

Github Contribution Drawer Python script for writing text on github contribution chart. Requirements Python 3.X Getting Started Create repository Put

Steven 0 May 27, 2022
matplotlib: plotting with Python

Matplotlib is a comprehensive library for creating static, animated, and interactive visualizations in Python. Check out our home page for more inform

Matplotlib Developers 16.7k Jan 08, 2023
Visualization of the World Religion Data dataset by Correlates of War Project.

World Religion Data Visualization Visualization of the World Religion Data dataset by Correlates of War Project. Mostly personal project to famirializ

Emile Bangma 1 Oct 15, 2022
A grammar of graphics for Python

plotnine Latest Release License DOI Build Status Coverage Documentation plotnine is an implementation of a grammar of graphics in Python, it is based

Hassan Kibirige 3.3k Jan 01, 2023
Area-weighted venn-diagrams for Python/matplotlib

Venn diagram plotting routines for Python/Matplotlib Routines for plotting area-weighted two- and three-circle venn diagrams. Installation The simples

Konstantin Tretyakov 400 Dec 31, 2022
A simple code for plotting figure, colorbar, and cropping with python

Python Plotting Tools This repository provides a python code to generate figures (e.g., curves and barcharts) that can be used in the paper to show th

Guanying Chen 134 Jan 02, 2023
Design your own matplotlib stylefile interactively

Tired of playing with font sizes and other matplotlib parameters every time you start a new project or write a new plotting function? Want all you plots have the same style? Use matplotlib configurat

yobi byte 207 Dec 08, 2022
Data Analysis: Data Visualization of Airlines

Data Analysis: Data Visualization of Airlines Anderson Cruz | London-UK | Linkedin | Nowa Capital Project: Traffic Airlines Airline Reporting Carrier

Anderson Cruz 1 Feb 10, 2022
Interactive Dashboard for Visualizing OSM Data Change

Dashboard and intuitive data downloader for more interactive experience with interpreting osm change data.

1 Feb 20, 2022
ecoglib: visualization and statistics for high density microecog signals

ecoglib: visualization and statistics for high density microecog signals This library contains high-level analysis tools for "topos" and "chronos" asp

1 Nov 17, 2021
patchwork for matplotlib

patchworklib patchwork for matplotlib test code Preparation of example plots import seaborn as sns import numpy as np import pandas as pd #Bri

Mori Hideto 185 Jan 06, 2023
Create 3d loss surface visualizations, with optimizer path. Issues welcome!

MLVTK A loss surface visualization tool Simple feed-forward network trained on chess data, using elu activation and Adam optimizer Simple feed-forward

7 Dec 21, 2022
Visualize large time-series data in plotly

plotly_resampler enables visualizing large sequential data by adding resampling functionality to Plotly figures. In this Plotly-Resampler demo over 11

PreDiCT.IDLab 604 Dec 28, 2022
Simulation du problème de Monty Hall avec Python et matplotlib

Le problème de Monty Hall C'est un jeu télévisé où il y a trois portes sur le plateau de jeu. Seule une de ces portes cache un trésor. Il n'y a rien d

ETCHART YANG 1 Jan 06, 2022
Some examples with MatPlotLib library in Python

MatPlotLib Example Some examples with MatPlotLib library in Python Point: Run files only in project's directory About me Full name: Matin Ardestani Ag

Matin Ardestani 4 Mar 29, 2022