Render Jupyter notebook in the terminal

Overview

jut - JUpyter notebook Terminal viewer.

The command line tool view the IPython/Jupyter notebook in the terminal.

Install

pip install jut

Usage

$jut --help
Usage: jut [OPTIONS]

Options:
  -u, --url TEXT             Render the ipynb file from the URL
  -i, --input-file FILENAME  File from the local file-system
  -h, --head INTEGER         Display first n cells. Default is 10
  -t, --tail INTEGER         Display last n cells
  -p, --single-page          Should the result be in a single page?
  -f, --full-display         Should all the contents in the file displayed?
  --help                     Show this message and exit.
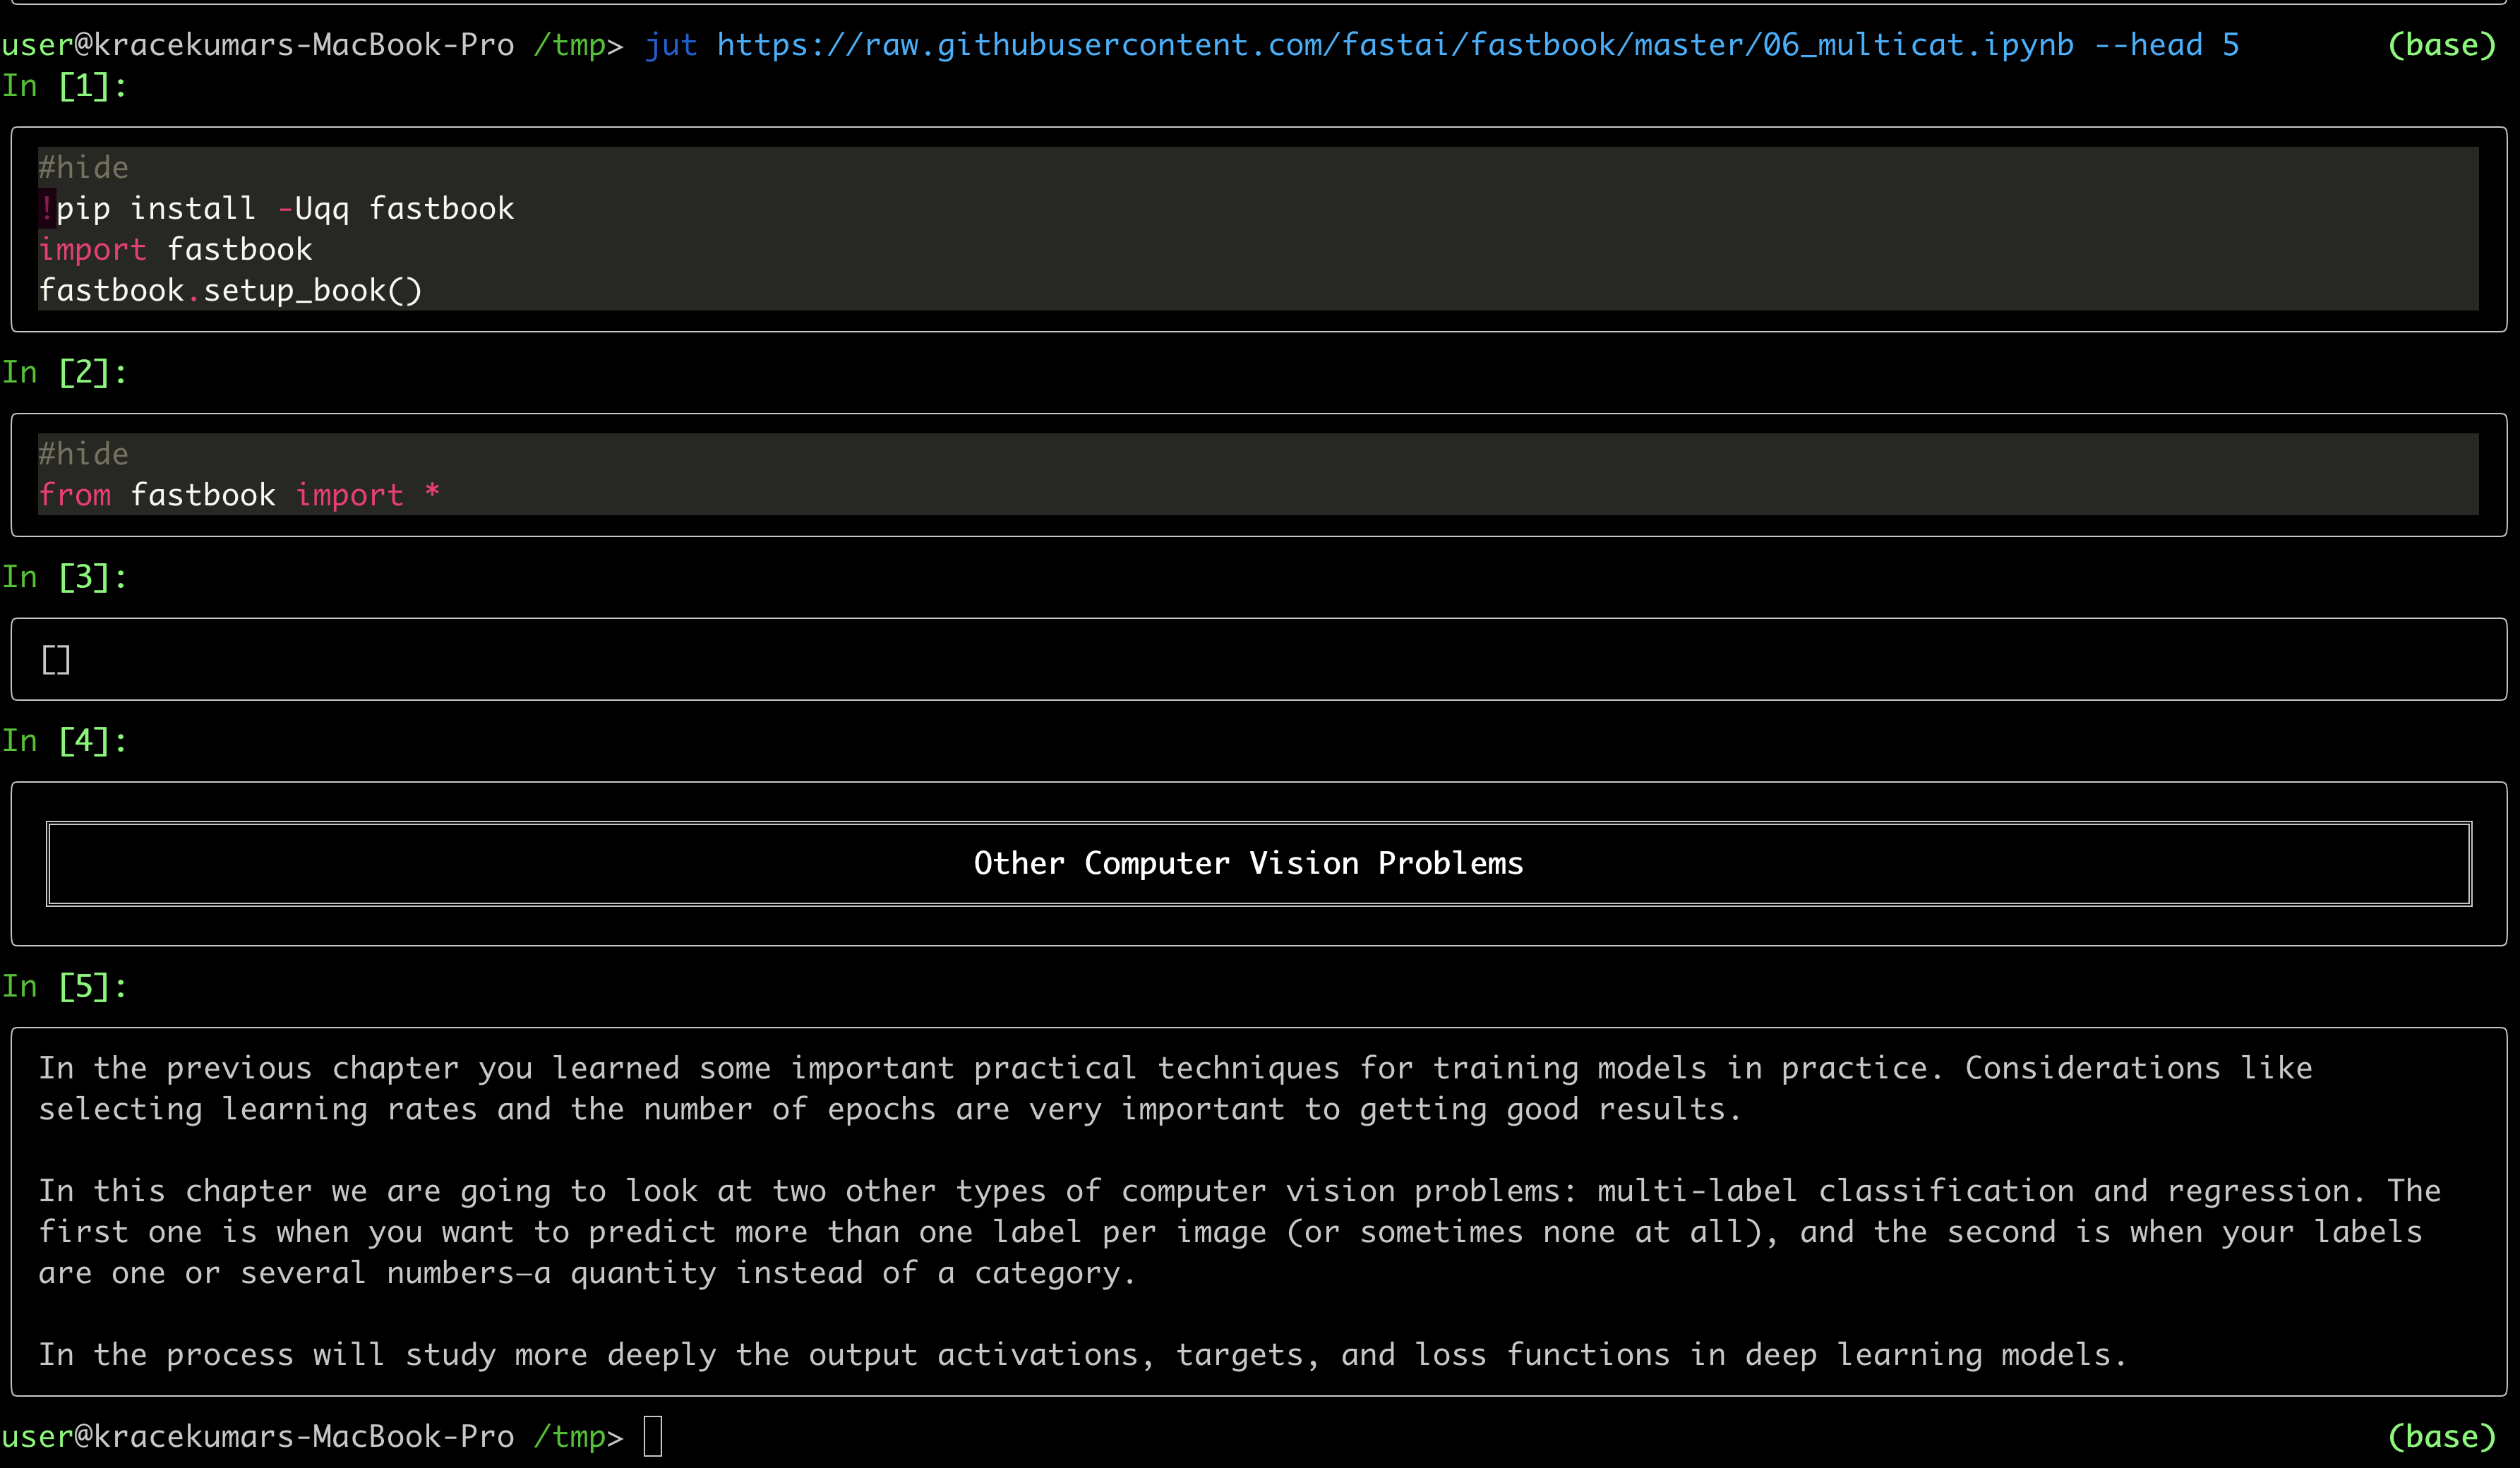
ASCIICinema Demo

asciicast

Display first five cells

jut-head-example

Display last five cells

jut-tail-example

Download the file and display first five cells

jut-download-url

Owner
Kracekumar
Server side guy specializing in Python. I am interested in back-end technologies, machine learning, automation, systems and performance.
Kracekumar
3D Vision functions with end-to-end support for deep learning developers, written in Ivy.

Ivy vision focuses predominantly on 3D vision, with functions for camera geometry, image projections, co-ordinate frame transformations, forward warping, inverse warping, optical flow, depth triangul

Ivy 61 Dec 29, 2022
Smarthome Dashboard with Grafana & InfluxDB

Smarthome Dashboard with Grafana & InfluxDB This is a complete overhaul of my Raspberry Dashboard done with Flask. I switched from sqlite to InfluxDB

6 Oct 20, 2022
Dimensionality reduction in very large datasets using Siamese Networks

ivis Implementation of the ivis algorithm as described in the paper Structure-preserving visualisation of high dimensional single-cell datasets. Ivis

beringresearch 284 Jan 01, 2023
Small project to recursively calculate and plot each successive order of the Hilbert Curve

hilbert-curve Small project to recursively calculate and plot each successive order of the Hilbert Curve. After watching 3Blue1Brown's video on Hilber

Stefan Mejlgaard 2 Nov 15, 2021
Python Data. Leaflet.js Maps.

folium Python Data, Leaflet.js Maps folium builds on the data wrangling strengths of the Python ecosystem and the mapping strengths of the Leaflet.js

6k Jan 02, 2023
Visualize the training curve from the *.csv file (tensorboard format).

Training-Curve-Vis Visualize the training curve from the *.csv file (tensorboard format). Feature Custom labels Curve smoothing Support for multiple c

Luckky 7 Feb 23, 2022
Turn a STAC catalog into a dask-based xarray

StackSTAC Turn a list of STAC items into a 4D xarray DataArray (dims: time, band, y, x), including reprojection to a common grid. The array is a lazy

Gabe Joseph 148 Dec 19, 2022
1900-2016 Olympic Data Analysis in Python by plotting different graphs

🔥 Olympics Data Analysis 🔥 In Data Science field, there is a big topic before creating a model for future prediction is Data Analysis. We can find o

Sayan Roy 1 Feb 06, 2022
Matplotlib JOTA style for making figures

Matplotlib JOTA style for making figures This repo has Matplotlib JOTA style to format plots and figures for publications and presentation.

JOTA JORNALISMO 2 May 05, 2022
Geospatial Data Visualization using PyGMT

Example script to visualize topographic data, earthquake data, and tomographic data on a map

Utpal Kumar 2 Jul 30, 2022
VDLdraw - Batch plot the log files exported from VisualDL using Matplotlib

VDLdraw Batch plot the log files exported from VisualDL using Matplotlib. At pre

Yizhou Chen 5 Sep 26, 2022
Productivity Tools for Plotly + Pandas

Cufflinks This library binds the power of plotly with the flexibility of pandas for easy plotting. This library is available on https://github.com/san

Jorge Santos 2.7k Dec 30, 2022
Data visualization electromagnetic spectrum

Datenvisualisierung-Elektromagnetischen-Spektrum Anhand des Moduls matplotlib sollen die Daten des elektromagnetischen Spektrums dargestellt werden. D

Pulsar 1 Sep 01, 2022
This project is an Algorithm Visualizer where a user can visualize algorithms like Bubble Sort, Merge Sort, Quick Sort, Selection Sort, Linear Search and Binary Search.

Algo_Visualizer This project is an Algorithm Visualizer where a user can visualize common algorithms like "Bubble Sort", "Merge Sort", "Quick Sort", "

Rahul 4 Feb 07, 2022
Main repository for Vispy

VisPy: interactive scientific visualization in Python Main website: http://vispy.org VisPy is a high-performance interactive 2D/3D data visualization

vispy 3k Jan 03, 2023
Python Data Validation for Humansâ„¢.

validators Python data validation for Humans. Python has all kinds of data validation tools, but every one of them seems to require defining a schema

Konsta Vesterinen 670 Jan 09, 2023
A visualization tool made in Pygame for various pathfinding algorithms.

Pathfinding-Visualizer 🚀 A visualization tool made in Pygame for various pathfinding algorithms. Pathfinding is closely related to the shortest path

Aysha sana 7 Jul 09, 2022
Visualize the bitcoin blockchain from your local node

Project Overview A new feature in Bitcoin Core 0.20 allows users to dump the state of the blockchain (the UTXO set) using the command dumptxoutset. I'

18 Sep 11, 2022
A tool for automatically generating 3D printable STLs from freely available lidar scan data.

mini-map-maker A tool for automatically generating 3D printable STLs from freely available lidar scan data. Screenshots Tutorial To use this script, g

Mike Abbott 51 Nov 06, 2022
Create animated and pretty Pandas Dataframe or Pandas Series

Rich DataFrame Create animated and pretty Pandas Dataframe or Pandas Series, as shown below: Installation pip install rich-dataframe Usage Minimal exa

Khuyen Tran 92 Dec 26, 2022