BrowZen correlates your emotional states with the web sites you visit to give you actionable insights about how you spend your time browsing the web.

Overview

BrowZen

BrowZen correlates your emotional states with the web sites you visit to give you actionable insights about how you spend your time browsing the web.

How It Works

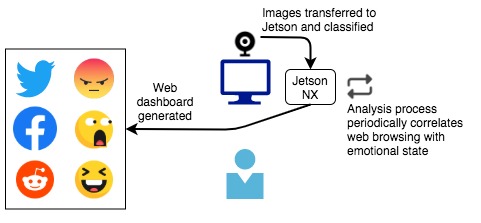
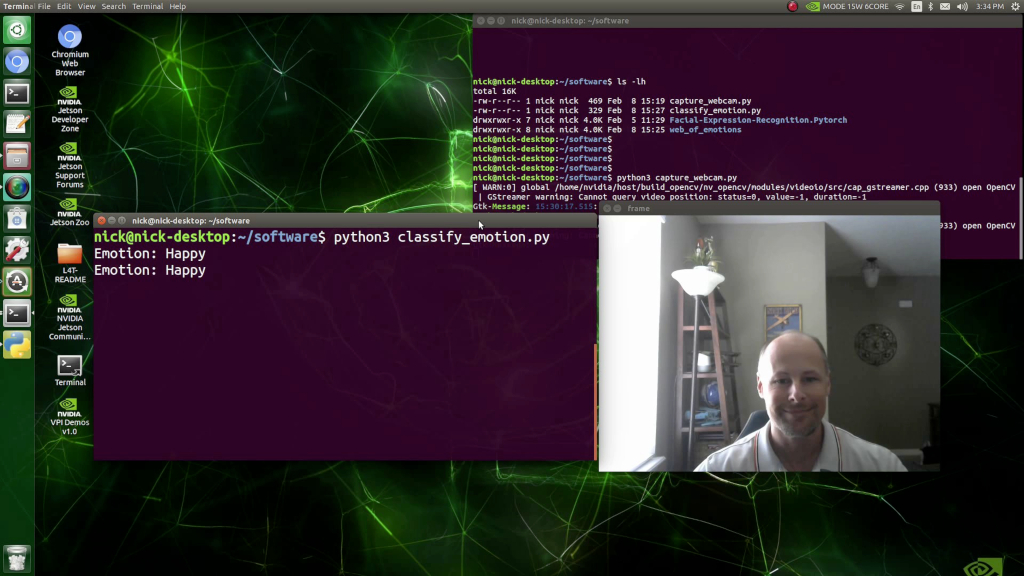
A webcam attached to an NVIDIA Jetson Xavier NX captures periodic images of the user of the computer as a background process. These images are classified (see classify_emotion.py) by a VGG19 convolutional neural network that has been pretrained to recognize seven emotional states ("Angry", "Disgust", "Fear", "Happy", "Sad", "Surprise", and "Neutral"). Observations (emotional state, datetime stamp) are recorded in an SQLite3 database. For privacy protection, images are destroyed after classification, and all processing takes place locally—nothing is sent to the cloud.

Next, analysis.py connects to the SQLite3 database that stores web history in Chrome/Chromium and correlates web site visit times with the database of emotional state observations created by the classification step. The result of the analysis, the sum of each emotional state observed while visiting each web site, is stored in an SQLite3 database table.

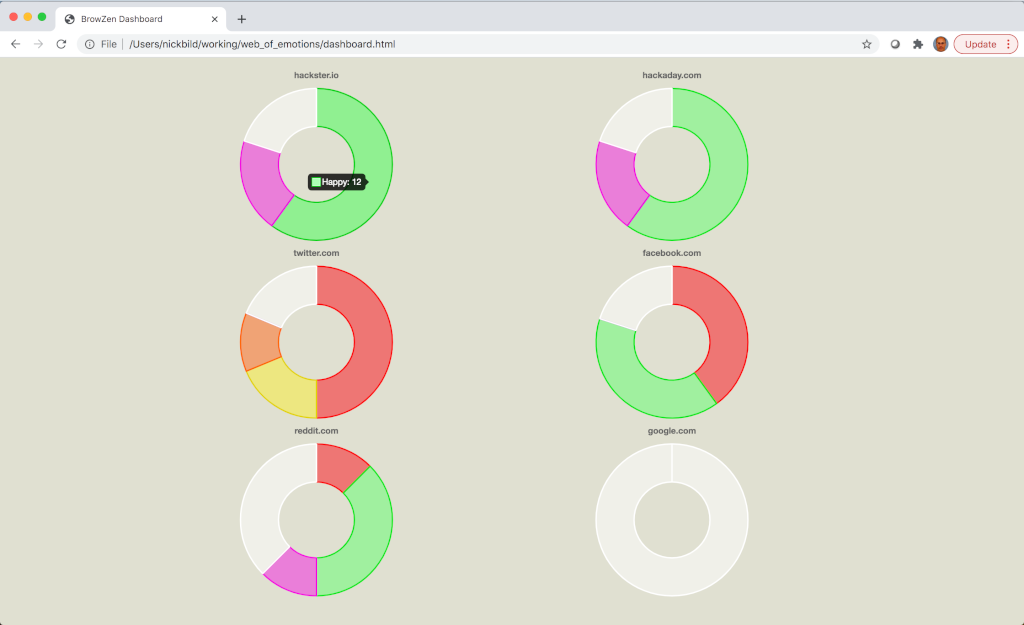
Finally, the analysis results are used to generate a web dashboard (generate_dashboard.py) to provide a simple way to visualize, on average, how each web site one visits impacts their emotional state. The web dashboard (dashboard.html) relies on only HTML5 and JavaScript.

Media

Demo Video: YouTube

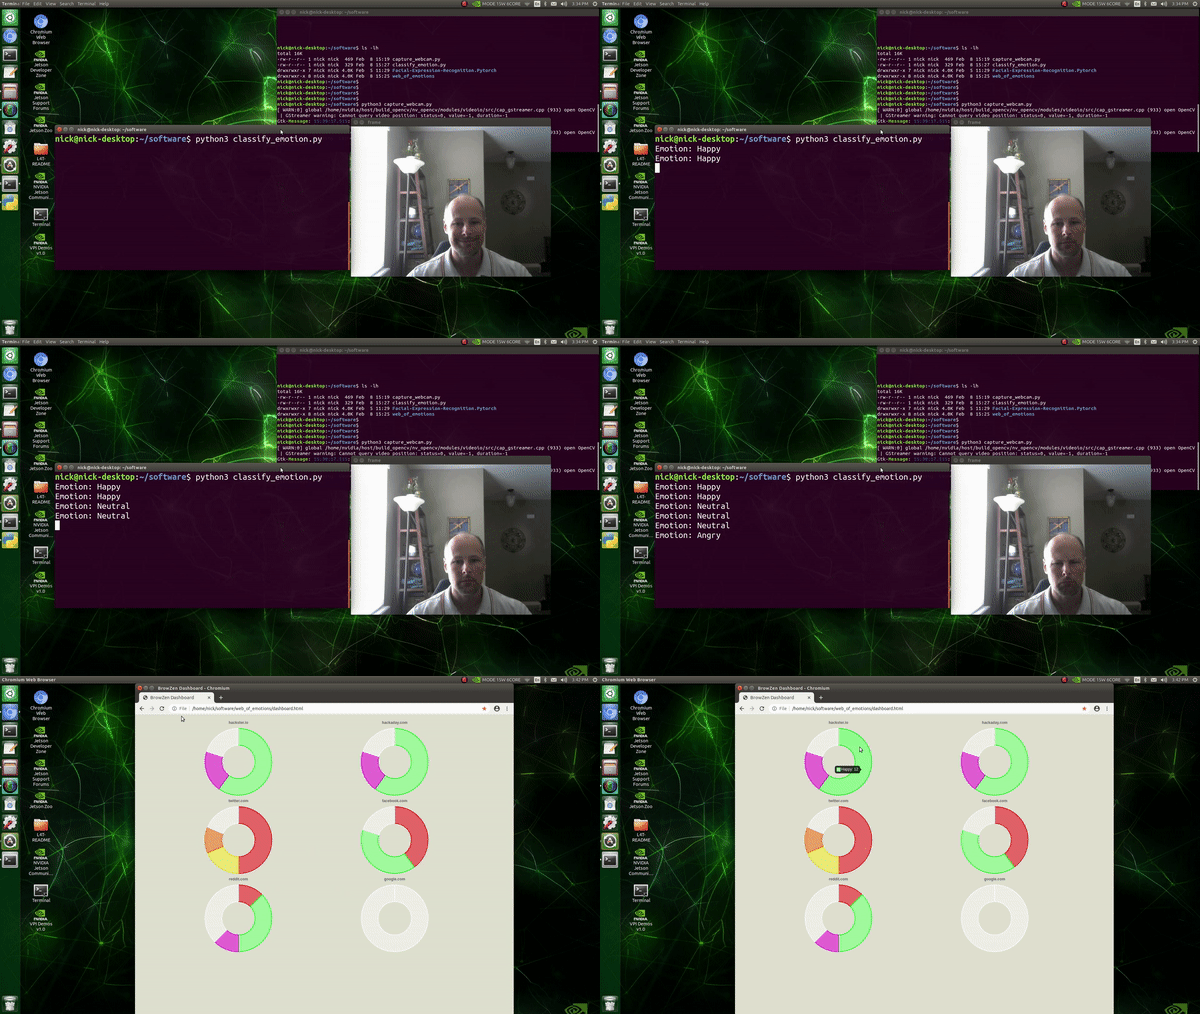
The web dashboard, giving an overview of emotional reactions during visits to various websites (high resolution): Dashboard
Classifying emotions in real-time (high resolution): Classification
Jetson Xavier NX (high resolution): Jetson

Future Direction

It may be useful to create a browser plugin that displays a small, always-visible icon representing past emotions experienced when visiting the current website. This would serve as a quick reminder of past experiences that may modify current behavior.

I would like to also explore other areas, beyond web browsing, where this idea may be helpful.

Bill of Materials

  • 1 x NVIDIA Jetson Xavier NX
  • 1 x USB webcam

About the Author

Nick A. Bild, MS

Owner
Nick Bild
R&D, creativity, and building the next big thing you never knew you wanted are my specialties.
Nick Bild
Example Code Notebooks for Data Visualization in Python

This repository contains sample code scripts for creating awesome data visualizations from scratch using different python libraries (such as matplotli

Javed Ali 27 Jan 04, 2023
An intuitive library to add plotting functionality to scikit-learn objects.

Welcome to Scikit-plot Single line functions for detailed visualizations The quickest and easiest way to go from analysis... ...to this. Scikit-plot i

Reiichiro Nakano 2.3k Dec 31, 2022
3D-Lorenz-Attractor-simulation-with-python

3D-Lorenz-Attractor-simulation-with-python Animação 3D da trajetória do Atrator de Lorenz, implementada em Python usando o método de Runge-Kutta de 4ª

Hevenicio Silva 17 Dec 08, 2022
Histogramming for analysis powered by boost-histogram

Hist Hist is an analyst-friendly front-end for boost-histogram, designed for Python 3.7+ (3.6 users get version 2.4). See what's new. Installation You

Scikit-HEP Project 97 Dec 25, 2022
📊📈 Serves up Pandas dataframes via the Django REST Framework for use in client-side (i.e. d3.js) visualizations and offline analysis (e.g. Excel)

📊📈 Serves up Pandas dataframes via the Django REST Framework for use in client-side (i.e. d3.js) visualizations and offline analysis (e.g. Excel)

wq framework 1.2k Jan 01, 2023
This plugin plots the time you spent on a tag as a histogram.

This plugin plots the time you spent on a tag as a histogram.

Tom Dörr 7 Sep 09, 2022
Plot-configurations for scientific publications, purely based on matplotlib

TUEplots Plot-configurations for scientific publications, purely based on matplotlib. Usage Please have a look at the examples in the example/ directo

Nicholas Krämer 487 Jan 08, 2023
Visualization Website by using Dash and Heroku

Visualization Website by using Dash and Heroku You can visit the website https://payroll-expense-analysis.herokuapp.com/ In this project, I am interes

YF Liu 1 Jan 14, 2022
Graphing communities on Twitch.tv in a visually intuitive way

VisualizingTwitchCommunities This project maps communities of streamers on Twitch.tv based on shared viewership. The data is collected from the Twitch

Kiran Gershenfeld 312 Jan 07, 2023
A minimal Python package that produces slice plots through h5m DAGMC geometry files

A minimal Python package that produces slice plots through h5m DAGMC geometry files Installation pip install dagmc_geometry_slice_plotter Python API U

Fusion Energy 4 Dec 02, 2022
Pydrawer: The Python package for visualizing curves and linear transformations in a super simple way

pydrawer 📐 The Python package for visualizing curves and linear transformations in a super simple way. ✏️ Installation Install pydrawer package with

Dylan Tintenfich 56 Dec 30, 2022
CompleX Group Interactions (XGI) provides an ecosystem for the analysis and representation of complex systems with group interactions.

XGI CompleX Group Interactions (XGI) is a Python package for the representation, manipulation, and study of the structure, dynamics, and functions of

Complex Group Interactions 67 Dec 28, 2022
An interactive dashboard built with python that enables you to visualise how rent prices differ across Sweden.

sweden-rent-dashboard An interactive dashboard built with python that enables you to visualise how rent prices differ across Sweden. The dashboard/web

Rory Crean 5 Dec 19, 2021
:small_red_triangle: Ternary plotting library for python with matplotlib

python-ternary This is a plotting library for use with matplotlib to make ternary plots plots in the two dimensional simplex projected onto a two dime

Marc 611 Dec 29, 2022
cqMore is a CadQuery plugin based on CadQuery 2.1.

cqMore (under construction) cqMore is a CadQuery plugin based on CadQuery 2.1. Installation Please use conda to install CadQuery and its dependencies

Justin Lin 36 Dec 21, 2022
Realtime Web Apps and Dashboards for Python and R

H2O Wave Realtime Web Apps and Dashboards for Python and R New! R Language API Build and control Wave dashboards using R! New! Easily integrate AI/ML

H2O.ai 3.4k Jan 06, 2023
A way of looking at COVID-19 data that I haven't seen before.

Visualizing Omicron: COVID-19 Deaths vs. Cases Click here for other countries. Data is from Our World in Data/Johns Hopkins University. About this pro

1 Jan 10, 2022
Scientific measurement library for instruments, experiments, and live-plotting

PyMeasure scientific package PyMeasure makes scientific measurements easy to set up and run. The package contains a repository of instrument classes a

PyMeasure 445 Jan 04, 2023
Data Analysis: Data Visualization of Airlines

Data Analysis: Data Visualization of Airlines Anderson Cruz | London-UK | Linkedin | Nowa Capital Project: Traffic Airlines Airline Reporting Carrier

Anderson Cruz 1 Feb 10, 2022
PyFlow is a general purpose visual scripting framework for python

PyFlow is a general purpose visual scripting framework for python. State Base structure of program implemented, such things as packages disco

1.8k Jan 07, 2023