Data Scientist in Simple Stock Analysis of PT Bukalapak.com Tbk for Long Term Investment
Brief explanation of PT Bukalapak.com Tbk
Bukalapak was founded on January 10, 2010 by Achmad Zaky, Nugroho Herucahyono, and Fajrin Rasyid in a boarding house while studying at the Bandung Institute of Technology. Bukalapak is one of the e-commerce companies in Indonesia. From the owner of a local shopping brand through an ownership group founded by Achmad Zaky, Nugroho Herucahyono, and Muhamad Fajrin Rasyid in 2010. Bukalapak was originally an online store that allowed Small and Medium Enterprises (SMEs) to venture into cyberspace. The company has now expanded into various other business lines, including helping to increase sales of traditional warungs through the Bukalapak Partner service. In 2017, Bukalapak became one of the unicorn startups from Indonesia. Currently, Bukalapak's valuation has reached 7.6 billion US dollars or around Rp. 110.2 trillion.
Bukalapak conducts Initial Public Offering of Shares
Bukalapak is the largest Initial Public Offering (IPO) company in Indonesia. This is the latest achievement that the Southeast Asian startup community is starting to grow. Quoting CNN.com, Saturday (8/7), Bukalapak reaped fresh funds of US $ 1.5 billion or Rp. 21.4 trillion (exchange rate of Rp. 14,300 per US dollar) from the corporate action. When Bukalapak's shares were traded on the first day, the price immediately jumped almost 25% in the first session. This indicates that many investors are hunting for Bukalapak's shares.
Mandiri Sekuritas said Bukalapak's IPO was oversubscribed by 8.7 times with orders from nearly 100 thousand investors. Bukalapak itself has developed into an e-commerce player in Southeast Asia. Some of Bukalapak's competitors, including Shopee, Lazada, and Tokopedia.
The company is backed by major investors, including Microsoft (MSFT) and Standard Chartered (SCBFF). The company plans to use the funds from the IPO to roll out more features. This will allow Bukalapak to offer more services and add new revenue streams. Indonesia's first unicorn to be listed on the stock exchange has great potential. BUKA is part of a conglomerate that has penetrated into various potential business lines.
As a data analyst, we can do a simple analysis on Bukalapak shares to assess whether the benefits provided are tempting for investors? or is it detrimental? on a long term basis. Through this simple analysis, we will calculate the Return On Investment on the Bukalapak stock
Simple Stock Analysis for Long Term Investment
A. Questions and Goals
- If we want to invest in long-term intervals, how can we reduce risk while maximizing return on investment?
- What is the best way to select stocks based on the criteria from the previous question? The purpose of this analysis is to look at Bukalapak's stock in providing a return on investment considering the risks involved. The analysis must provide substantial data to confidently use the stock for future analysis or use.
B. Data Collection
There are many ways to aggregate historical stock prices with their fundamentals. For this particular analysis, Pandas provides a library for retrieving forum data from multiple sources. The library is called Pandas Data Reader. The library is a wrapper for retrieving data like historical stock prices, country GDP, World economic data, etc. This analysis in particular. Yahoo Finance data is used because it is free and has a very large stock database. By avoiding manual, tedious work like downloading CSV files, analysis can be used for as much stock as possible. By doing import pandas_datareader.data as web
Since the final analysis will involve a return on investment, the Closing price is Adjusted. Used This option was taken to simplify the analysis. also, based on the adjusted closing price period, the price should best reflect the BUKA price on a given day.
Plotting Price BUKA Stock

The plot above shows the price of BUKA from the beginning of the IPO until November 2021. As expected, the data has shown a clear trend, namely a down trend. For example, let's take the return on investment if someone returns the money at the start of the IPO. Since plots of the same style will be widely used in this analysis, functions can be written to simplify future use.
Result Return On Investment

C. Data Analysis
With a quick glance at the data, there is some work to be done before it can be used. One of them is looking for a return on investment from every day. This is a necessary step. In Investing, the stock price on a given day is not very relevant. Price difference 2 different days.
Visualization ROI of BUKA Stock everyday

By looking at the graph above, although it's a bit difficult to tell the difference, there are some clues that can be taken. For example, the worst ROI occurred around August and October 2021 where it was less than -6%. However, the best day comes also around November 2021 where ROI exceeds 8% in one day. Furthermore, at the outset, it is stated that the analysis will be used to invest in long-term intervals. This means the daily ROI will be less relevant because the interval is too short. Resampling is a good way to convert data from daily ROI to monthly ROI.
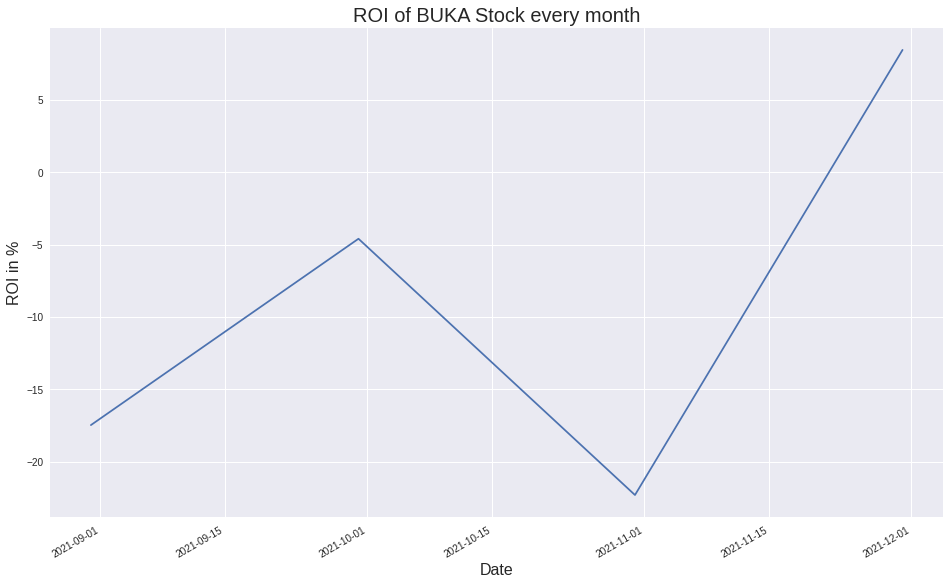
Visualization ROI of BUKA Stock every month
Describe
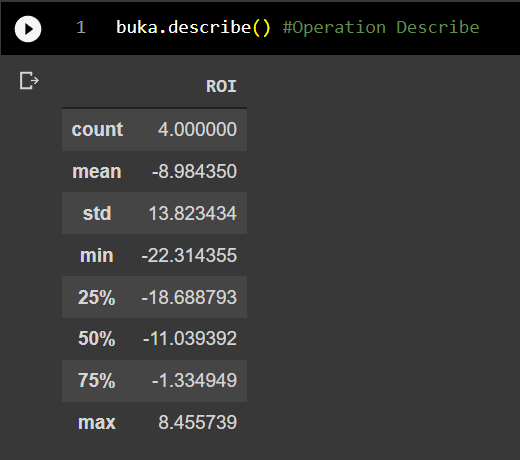
From the visualization and summary above, the data now looks a bit easier to read. For example, although ROIs fluctuate, they are not far from a certain point. This is called oscillation. The mean of the oscillations is the average of the data, the form of this example is -8.98 This also means, on average, one will earn an estimated ROI of -8.98% every month over a 4 month period. Of course this is not desired by investors, because it will result in losses. Then, their oscillations also have bounded upper and lower bounds, and it is called standard deviation or std. with a slight modification to the code, everything can be visualized as follows.
Visualization Volatility ROI of BUKA Stock every month

In stock prices, std is called volatility. This is an important metric because when large amounts of money are involved, less volatile stocks are more profitable. Less volatile stocks mean they are easier to predict because they are also less risky. Moreover, If the data is normally distributed, one is normally distributed. One that fits is the Q-Q plot.
Visualization Q-Q Plot

Using the statsmodels library, the Q-Q plot should show if the dataset is normally distributed. If most of the points fall on the red line, then the distribution is normally distributed. Unfortunately, not this data. So in short, collecting stock data over a 4 month period can yield a rough estimate for generating expectations about what ROI and risk are used for. Mean and Standard Deviation.
Conclusion
We can conclude that during the past 4 months, BUKA shares have been less attractive in terms of ROI. However, this BUKA stock is attractive to be included in an investor's portfolio because the price is already relatively cheap. In terms of long-term investment, this stock is attractive to buy considering that Bukalapak is a startup company with a high valuation. It is possible that in the long term there will be an increase. However, to determine whether the risk and ROI is high or low, a comparison with other stocks is needed.

 1 Nov 11, 2021
 2 Dec 01, 2021
 5 Dec 22, 2021
 4 Sep 05, 2022
 4 Jan 15, 2022
 4 Aug 06, 2022
 37 Dec 15, 2022
 20 Aug 27, 2022
 2 Nov 20, 2021
 2 Dec 12, 2021
 44 Sep 28, 2022
 21 Aug 30, 2022
 1 Feb 13, 2022
 6 Sep 07, 2022
 1 Nov 13, 2021
 210 Jan 02, 2023
 1 Jan 07, 2022
 10 Oct 27, 2021
 1 Feb 11, 2022
 0 Dec 01, 2021