The Metabolomics Integrator (MINT) is a post-processing tool for liquid chromatography-mass spectrometry (LCMS) based metabolomics.

Overview

CII Best Practices Github All Releases

MINT (Metabolomics Integrator)

The Metabolomics Integrator (MINT) is a post-processing tool for liquid chromatography-mass spectrometry (LCMS) based metabolomics. Metabolomics is the study of all metabolites (small chemical compounds) in a biological sample e.g. from bacteria or a human blood sample. The metabolites can be used to define biomarkers used in medicine to find treatments for diseases or for the development of diagnostic tests or for the identification of pathogens such as methicillin resistant Staphylococcus aureus (MRSA). More information on how to install and run the program can be found in the Documentation or check out the Quickstart to jump right into it.

Browser based as standalone application or server based

A demo server is available here. Be mindful, you share the server with others.

Metabolomics with Python

MINT originally started as Python project. The core of MINT is a Python class for targeted metabolomics that can be used independent of the graphical application.

from ms_mint.notebook import Mint
mint.ms_files = glob('/path/to/files/*mzML')
mint.peaklist_files = '/path/to/peaklist/file/peaklist.csv'
mint.run()
mint.results

Mint Jupyter Results

Contributions are welcome

MINT integrates open-source software and packages into a Python library for metabolomics with a browser based GUI. It is programmed by scientists for scientists to contribute to better and faster science integrating best practices of data management and computer science. Contributions are welcome that improve the efficiency of the code, bug fixes, feature implementations, security enhancements among others. If you want to contribute to MINT please send me a notification.

How to contribute

Errors, Feedback, Feature Requests

If you encounter an error, if you have a request for a new feature, or for general feedback, please open a new ticket at the issue tracker.

Code contributions

If your are up to enhance the codebase yourself, we ask you to followowing steps:

  1. fork the repository
  2. implement the new feature or bug-fix
  3. add corresponding tests
  4. run flake8
  5. submit a pull request

Code standards

Before submitting a pull request please run flake8.

Get in touch

Open an issue or join the slack channel.

Acknowledgements

This project would not be possible without the help of the open-source community. The tools and resources provided by GitHub, Docker-Hub, the Python Package Index, as well the answers from dedicated users on Stackoverflow and the Plotly community, as well as the free open-source packages used are the foundation of this project. Several people have made direct contributions to the codebase and we are extremely grateful for that.

  • @rokm refactored the specfile for Pyinstaller to create a windows package.
  • @bucknerns helped with the configuration of the versioneer file.

Last but not least, we want to thank all the users and early adopters that drive the development with feature requests and bug reports.

You might also like...
Simple spectra visualization tool for astronomers

SpecViewer A simple visualization tool for astronomers. Dependencies Python = 3.7.4 PyQt5 = 5.15.4 pyqtgraph == 0.10.0 numpy = 1.19.4 How to use py

A visualization tool made in Pygame for various pathfinding algorithms.

Pathfinding-Visualizer 🚀 A visualization tool made in Pygame for various pathfinding algorithms. Pathfinding is closely related to the shortest path

A command line tool for visualizing CSV/spreadsheet-like data

PerfPlotter Read data from CSV files using pandas and generate interactive plots using bokeh, which can then be embedded into HTML pages and served by

simple tool to paint axis x and y

simple tool to paint axis x and y

A System Metrics Monitoring Tool Built using Python3 , rabbitmq,Grafana and InfluxDB. Setup using docker compose. Use to monitor system performance with graphical interface of grafana , storage of influxdb and message queuing of rabbitmq Bioinformatics tool for exploring RNA-Protein interactions
Bioinformatics tool for exploring RNA-Protein interactions

Explore RNA-Protein interactions. RNPFind is a bioinformatics tool. It takes an RNA transcript as input and gives a list of RNA binding protein (RBP)

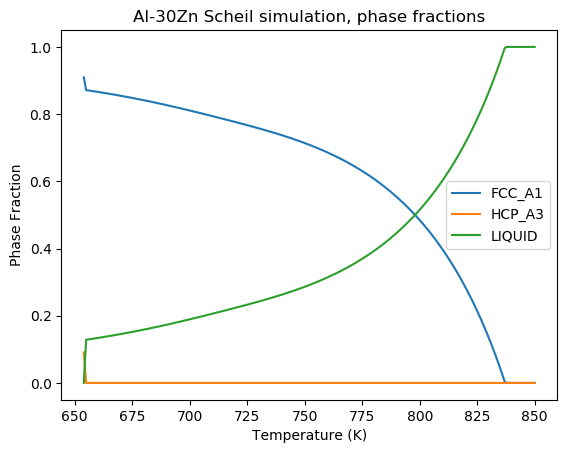
A Scheil-Gulliver simulation tool using pycalphad.

scheil A Scheil-Gulliver simulation tool using pycalphad. import matplotlib.pyplot as plt from pycalphad import Database, variables as v from scheil i

A tool for automatically generating 3D printable STLs from freely available lidar scan data.

mini-map-maker A tool for automatically generating 3D printable STLs from freely available lidar scan data. Screenshots Tutorial To use this script, g

The Spectral Diagram (SD) is a new tool for the comparison of time series in the frequency domain

The Spectral Diagram (SD) is a new tool for the comparison of time series in the frequency domain. The SD provides a novel way to display the coherence function, power, amplitude, phase, and skill score of discrete frequencies of two time series. Each SD summarises these quantities in a single plot for multiple targeted frequencies.

Comments
  • error

    error

    Hello, first of all congratulations for the application. I tried to run the application but got an error. First of all, the application is constantly updating itself in the part with dash. Secondly, when it comes to the upload data part, the following calback error appears.

    Callback error updating {"index": "ms-uploader-output", "type": "output"}, "children" TypeError: expected str, bytes or os.PathLike object, not list fn_new = P(ms_dir) / P(fn).name I couldn't run it, it seems to load the data, but it doesn't, giving these errors.

    (I guess P(fn).name doesn't see it as path.)

    opened by hilaluzunoglu 0
Releases(0.0.56)
Owner
Sören Wacker
Research Associate in the Lewis Research Group at the University of Calgary.
Sören Wacker
Painlessly create beautiful matplotlib plots.

Announcement Thank you to everyone who has used prettyplotlib and made it what it is today! Unfortunately, I no longer have the bandwidth to maintain

Olga Botvinnik 1.6k Jan 06, 2023
Implementation of SOMs (Self-Organizing Maps) with neighborhood-based map topologies.

py-self-organizing-maps Simple implementation of self-organizing maps (SOMs) A SOM is an unsupervised method for learning a mapping from a discrete ne

Jonas Grebe 6 Nov 22, 2022
The visual framework is designed on the idea of module and implemented by mixin method

Visual Framework The visual framework is designed on the idea of module and implemented by mixin method. Its biggest feature is the mixins module whic

LEFTeyes 9 Sep 19, 2022
An open-source tool for visual and modular block programing in python

PyFlow PyFlow is an open-source tool for modular visual programing in python ! Although for now the tool is in Beta and features are coming in bit by

1.1k Jan 06, 2023
A set of three functions, useful in geographical calculations of different sorts

GreatCircle A set of three functions, useful in geographical calculations of different sorts. Available for PHP, Python, Javascript and Ruby. Live dem

72 Sep 30, 2022
Handout for the tutorial "Creating publication-quality figures with matplotlib"

Handout for the tutorial "Creating publication-quality figures with matplotlib"

JB Mouret 1.9k Jan 02, 2023
Visualization of hidden layer activations of small multilayer perceptrons (MLPs)

MLP Hidden Layer Activation Visualization To gain some intuition about the internal representation of simple multi-layer perceptrons (MLPs) I trained

Andreas Köpf 7 Dec 30, 2022
100 Days of Code The Complete Python Pro Bootcamp for 2022

100-Day-With-Python 100 Days of Code - The Complete Python Pro Bootcamp for 2022. In this course, I spend with python language over 100 days, and I up

Rajdip Das 8 Jun 22, 2022
This is Pygrr PolyArt, a program used for drawing custom Polygon models for your Pygrr project!

This is Pygrr PolyArt, a program used for drawing custom Polygon models for your Pygrr project!

Isaac 4 Dec 14, 2021
mysql relation charts

sqlcharts 自动生成数据库关联关系图 复制settings.py.example 重命名为settings.py 将数据库配置信息填入settings.DATABASE,目前支持mysql和postgresql 执行 python build.py -b,-b是读取数据库表结构,如果只更新匹

6 Aug 22, 2022
Attractors is a package for simulation and visualization of strange attractors.

attractors Attractors is a package for simulation and visualization of strange attractors. Installation The simplest way to install the module is via

Vignesh M 45 Jul 31, 2022
Library for exploring and validating machine learning data

TensorFlow Data Validation TensorFlow Data Validation (TFDV) is a library for exploring and validating machine learning data. It is designed to be hig

688 Jan 03, 2023
Streamlit component for Let's-Plot visualization library

streamlit-letsplot This is a work-in-progress, providing a convenience function to plot charts from the Lets-Plot visualization library. Example usage

Randy Zwitch 9 Nov 03, 2022
Voilà, install macOS on ANY Computer! This is really and magic easiest way!

OSX-PROXMOX - Run macOS on ANY Computer - AMD & Intel Install Proxmox VE v7.02 - Next, Next & Finish (NNF). Open Proxmox Web Console - Datacenter N

Gabriel Luchina 654 Jan 09, 2023
Material for dataviz course at university of Bordeaux

Material for dataviz course at university of Bordeaux

Nicolas P. Rougier 50 Jul 17, 2022
Arras.io Highest Scores Over Time Bar Chart Race

Arras.io Highest Scores Over Time Bar Chart Race This repo contains a python script (make_racing_bar_chart.py) that can generate a csv file which can

Road 2 Jan 16, 2022
Small project to recursively calculate and plot each successive order of the Hilbert Curve

hilbert-curve Small project to recursively calculate and plot each successive order of the Hilbert Curve. After watching 3Blue1Brown's video on Hilber

Stefan Mejlgaard 2 Nov 15, 2021
A simple agent-based model used to teach the basics of OOP in my lectures

Pydemic A simple agent-based model of a pandemic. This is used to teach basic principles of object-oriented programming to master students. It is not

Fabien Maussion 2 Jun 08, 2022
Python scripts to manage Chia plots and drive space, providing full reports. Also monitors the number of chia coins you have.

Chia Plot, Drive Manager & Coin Monitor (V0.5 - April 20th, 2021) Multi Server Chia Plot and Drive Management Solution Be sure to ⭐ my repo so you can

338 Nov 25, 2022
Here I plotted data for the average test scores across schools and class sizes across school districts.

HW_02 Here I plotted data for the average test scores across schools and class sizes across school districts. Average Test Score by Race This graph re

7 Oct 27, 2021