Personal IMDB Graphs with Bokeh

Overview

Personal IMDB Graphs with Bokeh

Do you like watching movies and also rate all of them in IMDB? Would you like to look at your IMDB stats based on your rated movie data? And also would like to see a bunch of graphs and tables. Come in then, this little script is for you!

Usage

Just start main.py. Also you could start manually (start separetly):

    bokeh serve --show main/ --port 5001
    bokeh serve all_movies/ circles/ directors/ heatmaps/ line_charts/ piecharts/ ratings_with_years/ ratings_with_genres/ stack/ tv_series/ --port 5002

Also, you could start separetly : bokeh serve --show line_charts/

Dependencies

  • Bokeh 2.4
  • Pandas
  • pybase64 (only for reading your .csv file in main/ folder)

Any error? New Ideas?

Please feel free to pull request, If you found any problem. Also you could contact me with [email protected]

Screenshots

All Movies Line Charts Directors Datatable Pie Chart Heatmap Heatmap Stack Circles

For more screenshots, look at Screenshots/ folder.

You might also like...
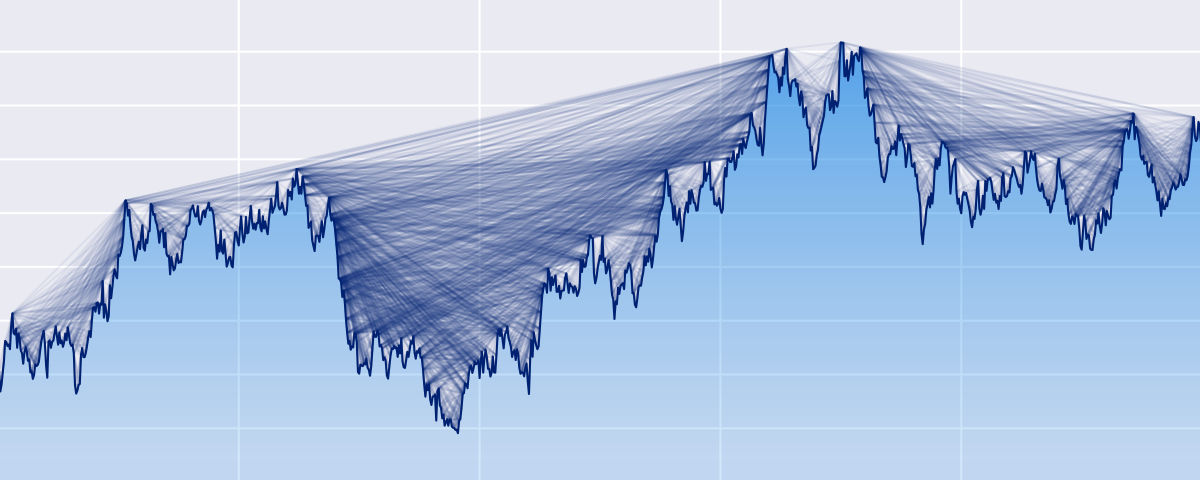
Python ts2vg package provides high-performance algorithm implementations to build visibility graphs from time series data.

ts2vg: Time series to visibility graphs The Python ts2vg package provides high-performance algorithm implementations to build visibility graphs from t

 Flame Graphs visualize profiled code
Flame Graphs visualize profiled code

Flame Graphs visualize profiled code

A simple interpreted language for creating basic mathematical graphs.

graphr Introduction graphr is a small language written to create basic mathematical graphs. It is an interpreted language written in python and essent

Mapomatic - Automatic mapping of compiled circuits to low-noise sub-graphs

mapomatic Automatic mapping of compiled circuits to low-noise sub-graphs Overvie

Kglab - an abstraction layer in Python for building knowledge graphs

Graph Data Science: an abstraction layer in Python for building knowledge graphs, integrated with popular graph libraries – atop Pandas, RDFlib, pySHACL, RAPIDS, NetworkX, iGraph, PyVis, pslpython, pyarrow, etc.

Fully Automated YouTube Channel ▶️with Added Extra Features.

Fully Automated Youtube Channel ▒█▀▀█ █▀▀█ ▀▀█▀▀ ▀▀█▀▀ █░░█ █▀▀▄ █▀▀ █▀▀█ ▒█▀▀▄ █░░█ ░░█░░ ░▒█░░ █░░█ █▀▀▄ █▀▀ █▄▄▀ ▒█▄▄█ ▀▀▀▀ ░░▀░░ ░▒█░░ ░▀▀▀ ▀▀▀░

Bokeh Plotting Backend for Pandas and GeoPandas

Pandas-Bokeh provides a Bokeh plotting backend for Pandas, GeoPandas and Pyspark DataFrames, similar to the already existing Visualization feature of

Bokeh Plotting Backend for Pandas and GeoPandas

Pandas-Bokeh provides a Bokeh plotting backend for Pandas, GeoPandas and Pyspark DataFrames, similar to the already existing Visualization feature of

A real-time financial data streaming pipeline and visualization platform using Apache Kafka, Cassandra, and Bokeh.

Realtime Financial Market Data Visualization and Analysis Introduction This repo shows my project about real-time stock data pipeline. All the code is

Personal Finance Forecaster - An AI tool for forecasting personal expenses

Personal Finance Forecaster - An AI tool for forecasting personal expenses

IMDbPY is a Python package useful to retrieve and manage the data of the IMDb movie database about movies, people, characters and companies

IMDbPY is a Python package for retrieving and managing the data of the IMDb movie database about movies, people and companies. Revamp notice Starting

IMDB film review sentiment classification based on BERT's supervised learning model.

IMDB film review sentiment classification based on BERT's supervised learning model. On the other hand, the model can be extended to other natural language multi-classification tasks.

IMDb + Auto + Unlimited Filter BoT

Telegram Movie Bot Features Auto Filter Manuel Filter IMDB Admin Commands Broadcast Index IMDB search Inline Search Random pics ids and User info Stat

Rottentomatoes, Goodreads and IMDB sites crawler. Semantic Web final project.

Crawler Rottentomatoes, Goodreads and IMDB sites crawler. Crawler written by beautifulsoup, selenium and lxml to gather books and films information an

IMDb + Auto + Unlimited Filter BoT

Telegram Movie Bot Features Auto Filter Manuel Filter IMDB Admin Commands Broadcast Index IMDB search Inline Search Random pics ids and User info Stat

Machine Learning Course Project, IMDB movie review sentiment analysis by lstm, cnn, and transformer

IMDB Sentiment Analysis This is the final project of Machine Learning Courses in Huazhong University of Science and Technology, School of Artificial I

Python IMDB Docker - A docker tutorial to containerize a python script.

Python_IMDB_Docker A docker tutorial to containerize a python script. Build the docker in the current directory: docker build -t python-imdb . Run the

Text classification on IMDB dataset using Keras and Bi-LSTM network

Text classification on IMDB dataset using Keras and Bi-LSTM Text classification on IMDB dataset using Keras and Bi-LSTM network. Usage python3 main.py

Notflix - Notion / Netflix and IMDb to organise your movie dates. Happy Valentine <3 from 0x1za
Notflix - Notion / Netflix and IMDb to organise your movie dates. Happy Valentine 3 from 0x1za

Welcome to notflix 👋 This is a project to help organise shows to watch with my

Releases(v1.0)
  • v1.0(Oct 6, 2021)

    Do you like watching movies and also rate all of them in IMDB? Would you like to look at your IMDB stats based on your rated movie data? And also would like to see a bunch of graphs and tables. Come in then, this little script is for you!

    Source code(tar.gz)
    Source code(zip)
A high performance implementation of HDBSCAN clustering. http://hdbscan.readthedocs.io/en/latest/

HDBSCAN Now a part of scikit-learn-contrib HDBSCAN - Hierarchical Density-Based Spatial Clustering of Applications with Noise. Performs DBSCAN over va

Leland McInnes 91 Dec 29, 2022
Scientific Visualization: Python + Matplotlib

An open access book on scientific visualization using python and matplotlib

Nicolas P. Rougier 8.6k Dec 31, 2022
Simple, realtime visualization of neural network training performance.

pastalog Simple, realtime visualization server for training neural networks. Use with Lasagne, Keras, Tensorflow, Torch, Theano, and basically everyth

Rewon Child 416 Dec 29, 2022
Analytical Web Apps for Python, R, Julia, and Jupyter. No JavaScript Required.

Dash Dash is the most downloaded, trusted Python framework for building ML & data science web apps. Built on top of Plotly.js, React and Flask, Dash t

Plotly 17.9k Dec 31, 2022
Learn Data Science with focus on adding value with the most efficient tech stack.

DataScienceWithPython Get started with Data Science with Python An engaging journey to become a Data Scientist with Python TL;DR Download all Jupyter

Learn Python with Rune 110 Dec 22, 2022
Easily convert matplotlib plots from Python into interactive Leaflet web maps.

mplleaflet mplleaflet is a Python library that converts a matplotlib plot into a webpage containing a pannable, zoomable Leaflet map. It can also embe

Jacob Wasserman 502 Dec 28, 2022
Area-weighted venn-diagrams for Python/matplotlib

Venn diagram plotting routines for Python/Matplotlib Routines for plotting area-weighted two- and three-circle venn diagrams. Installation The simples

Konstantin Tretyakov 400 Dec 31, 2022
Python ts2vg package provides high-performance algorithm implementations to build visibility graphs from time series data.

ts2vg: Time series to visibility graphs The Python ts2vg package provides high-performance algorithm implementations to build visibility graphs from t

Carlos Bergillos 26 Dec 17, 2022
Create 3d loss surface visualizations, with optimizer path. Issues welcome!

MLVTK A loss surface visualization tool Simple feed-forward network trained on chess data, using elu activation and Adam optimizer Simple feed-forward

7 Dec 21, 2022
Graphical visualizer for spectralyze by Lauchmelder23

spectralyze visualizer Graphical visualizer for spectralyze by Lauchmelder23 Install Install matplotlib and ffmpeg. Put ffmpeg.exe in same folder as v

Matthew 1 Dec 21, 2021
A guide for using Bootstrap 5 classes in Dash Bootstrap Components V1

dash-bootstrap-cheatsheet This handy interactive cheatsheet makes it easy to use the Bootstrap 5 classes with your Dash app made with the latest versi

10 Dec 22, 2022
This Crash Course will cover all you need to know to start using Plotly in your projects.

Plotly Crash Course This course was designed to help you get started using Plotly. If you ever felt like your data visualization skills could use an u

Fábio Neves 2 Aug 21, 2022
FURY - A software library for scientific visualization in Python

Free Unified Rendering in Python A software library for scientific visualization in Python. General Information • Key Features • Installation • How to

169 Dec 21, 2022
Easily configurable, chart dashboards from any arbitrary API endpoint. JSON config only

Flask JSONDash Easily configurable, chart dashboards from any arbitrary API endpoint. JSON config only. Ready to go. This project is a flask blueprint

Chris Tabor 3.3k Dec 31, 2022
Python toolkit for defining+simulating+visualizing+analyzing attractors, dynamical systems, iterated function systems, roulette curves, and more

Attractors A small module that provides functions and classes for very efficient simulation and rendering of iterated function systems; dynamical syst

1 Aug 04, 2021
daily report of @arkinvest ETF activity + data collection

ark_invest daily weekday report of @arkinvest ETF activity + data collection This script was created to: Extract and save daily csv's from ARKInvest's

T D 27 Jan 02, 2023
Data science project for exploratory analysis on the kcse grades dataset (Kamilimu Data Science Track)

Kcse-Data-Analysis Data science project for exploratory analysis on the kcse grades dataset (Kamilimu Data Science Track) Findings The performance of

MUGO BRIAN 1 Feb 23, 2022
Some method of processing point cloud

Point-Cloud Some method of processing point cloud inversion the completion pointcloud to incomplete point cloud Some model of encoding point cloud to

Tan 1 Nov 19, 2021
These data visualizations were created as homework for my CS40 class. I hope you enjoy!

Data Visualizations These data visualizations were created as homework for my CS40 class. I hope you enjoy! Nobel Laureates by their Country of Birth

9 Sep 02, 2022
A simple interpreted language for creating basic mathematical graphs.

graphr Introduction graphr is a small language written to create basic mathematical graphs. It is an interpreted language written in python and essent

2 Dec 26, 2021