Sci palettes for matplotlib/seaborn

Overview

sci palettes for matplotlib/seaborn

Installation

python3 -m pip install sci-palettes

Usage

import seaborn as sns
import matplotlib.pyplot as plt
import sci_palettes


print(sci_palettes.PALETTES.keys())

sci_palettes.register_cmap()          # register all palettes
sci_palettes.register_cmap('aaas')    # register a special palette

# methods for setting palette
plt.set_cmap('aaas')
plt.style.use('aaas')
sns.set_theme(palette='aaas')
sns.set_palette('aaas')

sns.scatterplot(...)

# set palette when plotting
sns.scatterplot(..., palette='aaas')

Full examples in examples
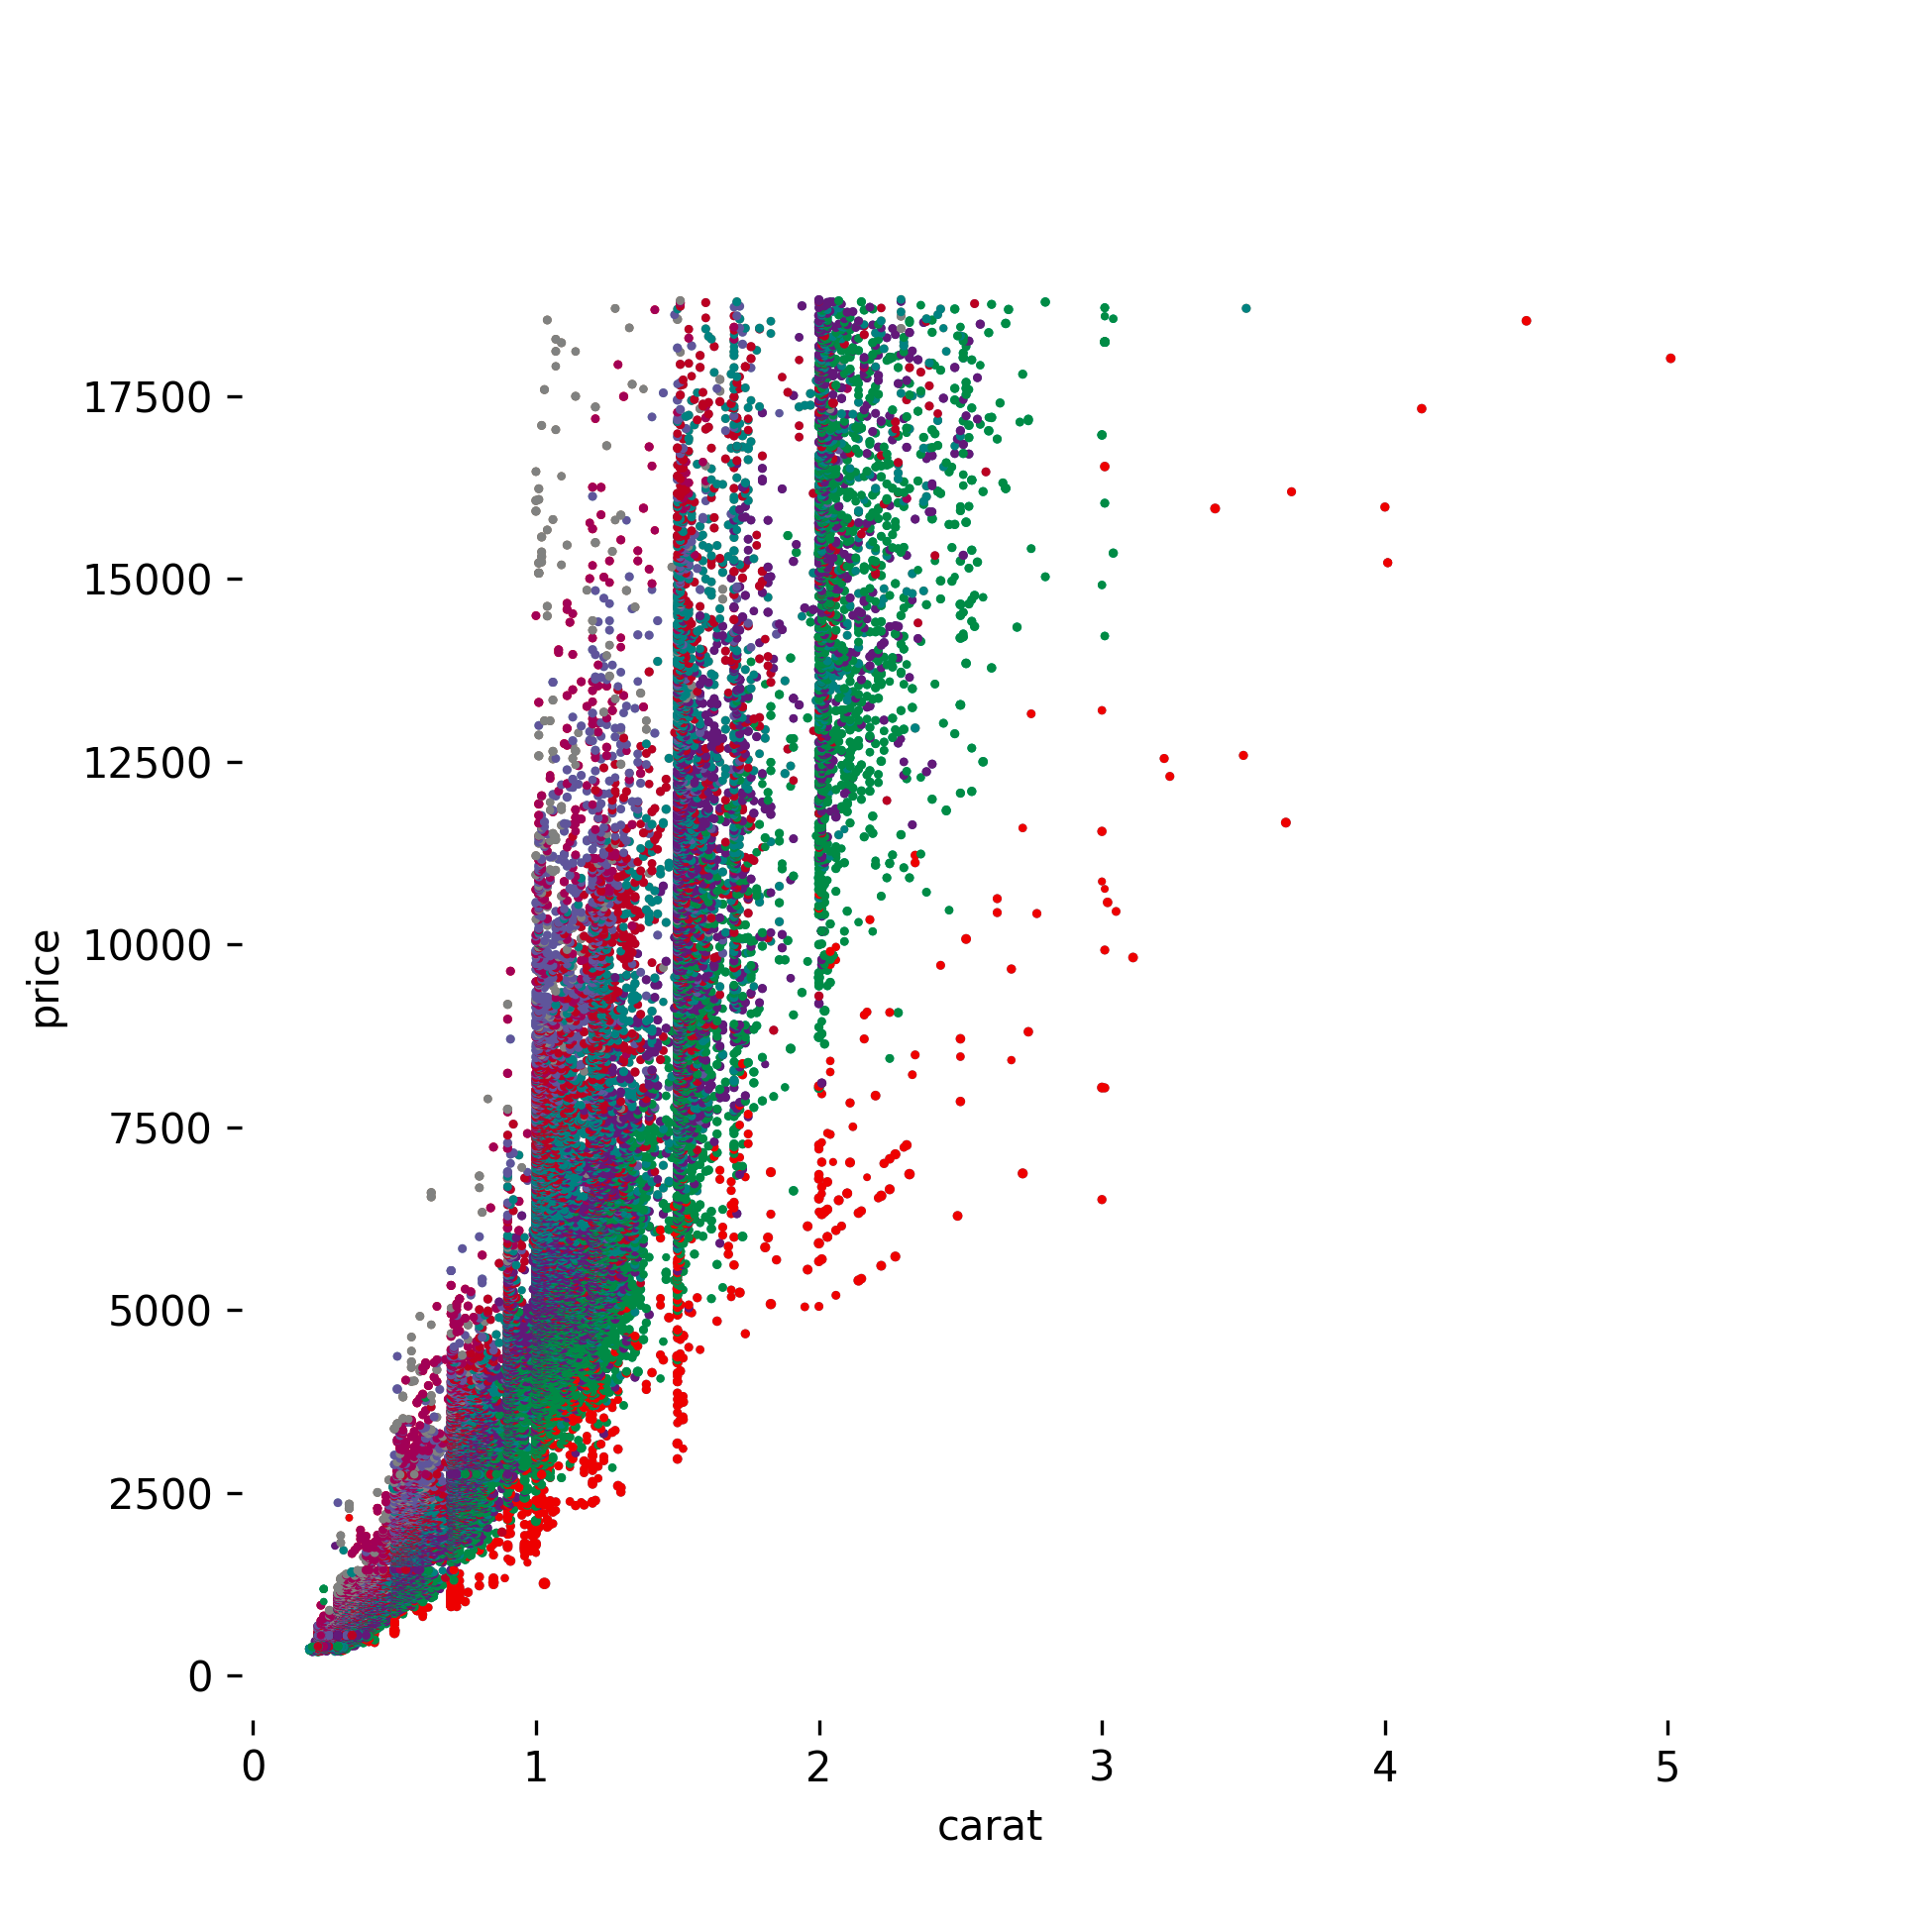
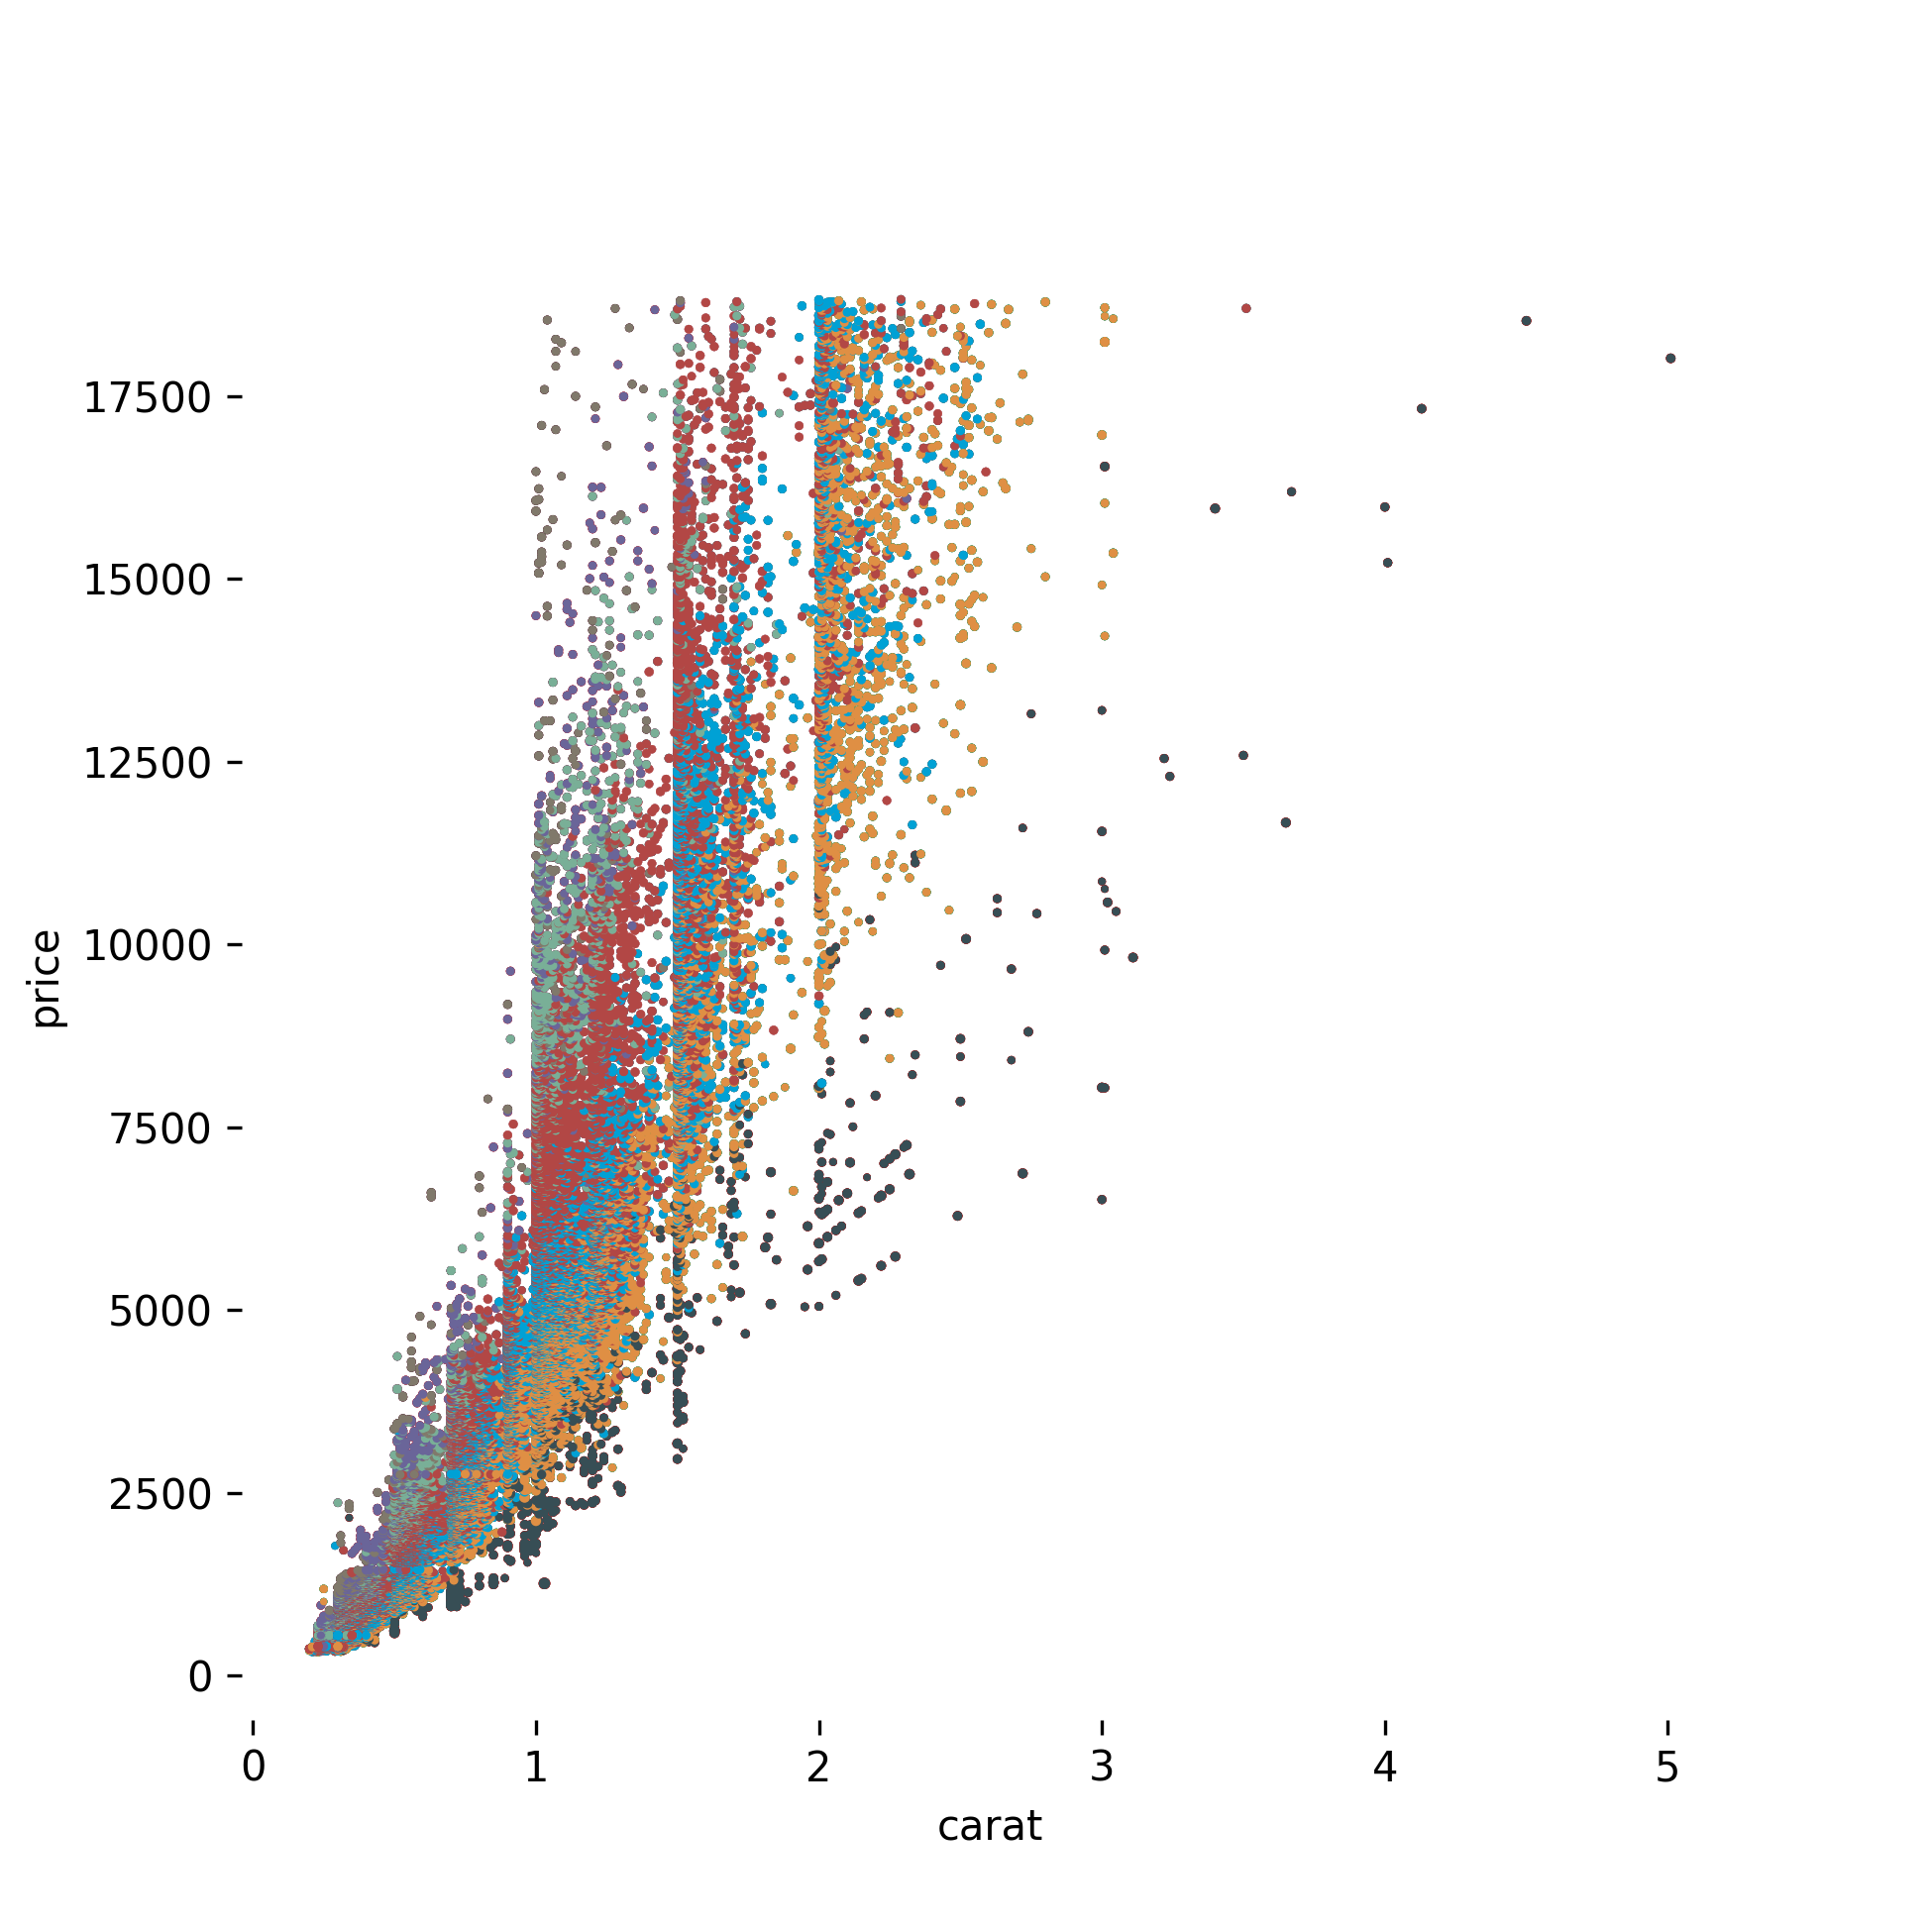
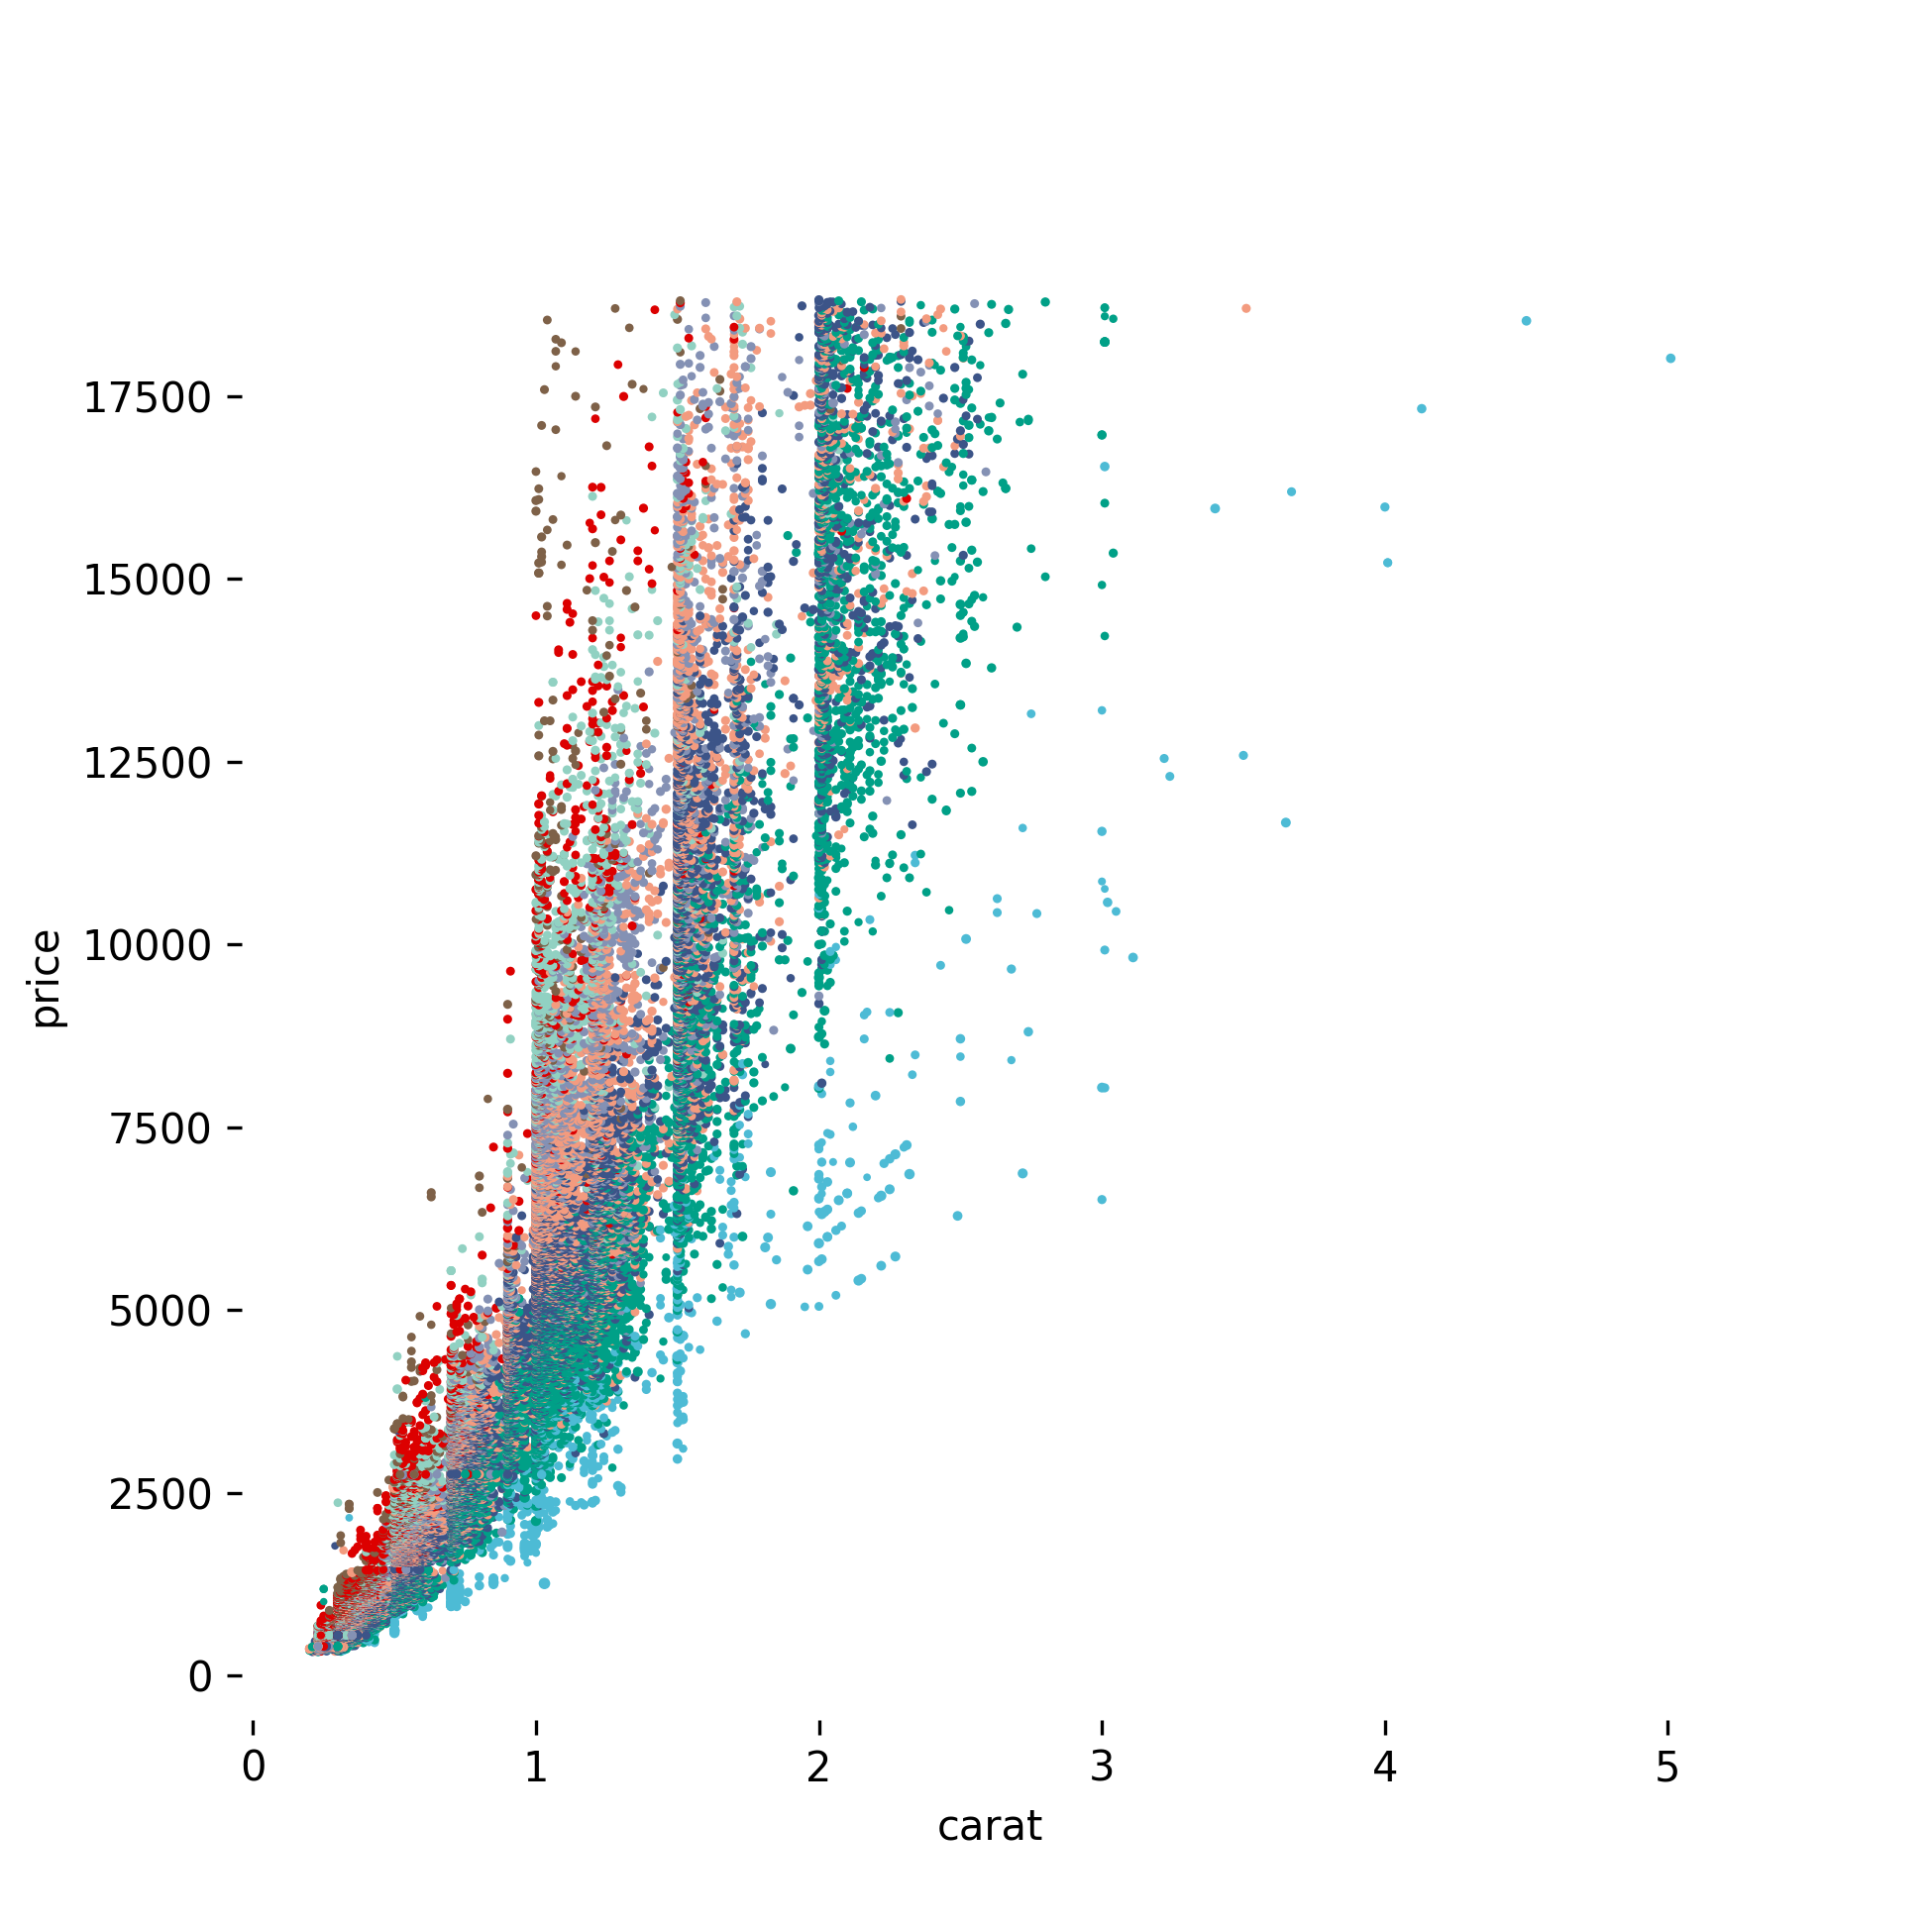
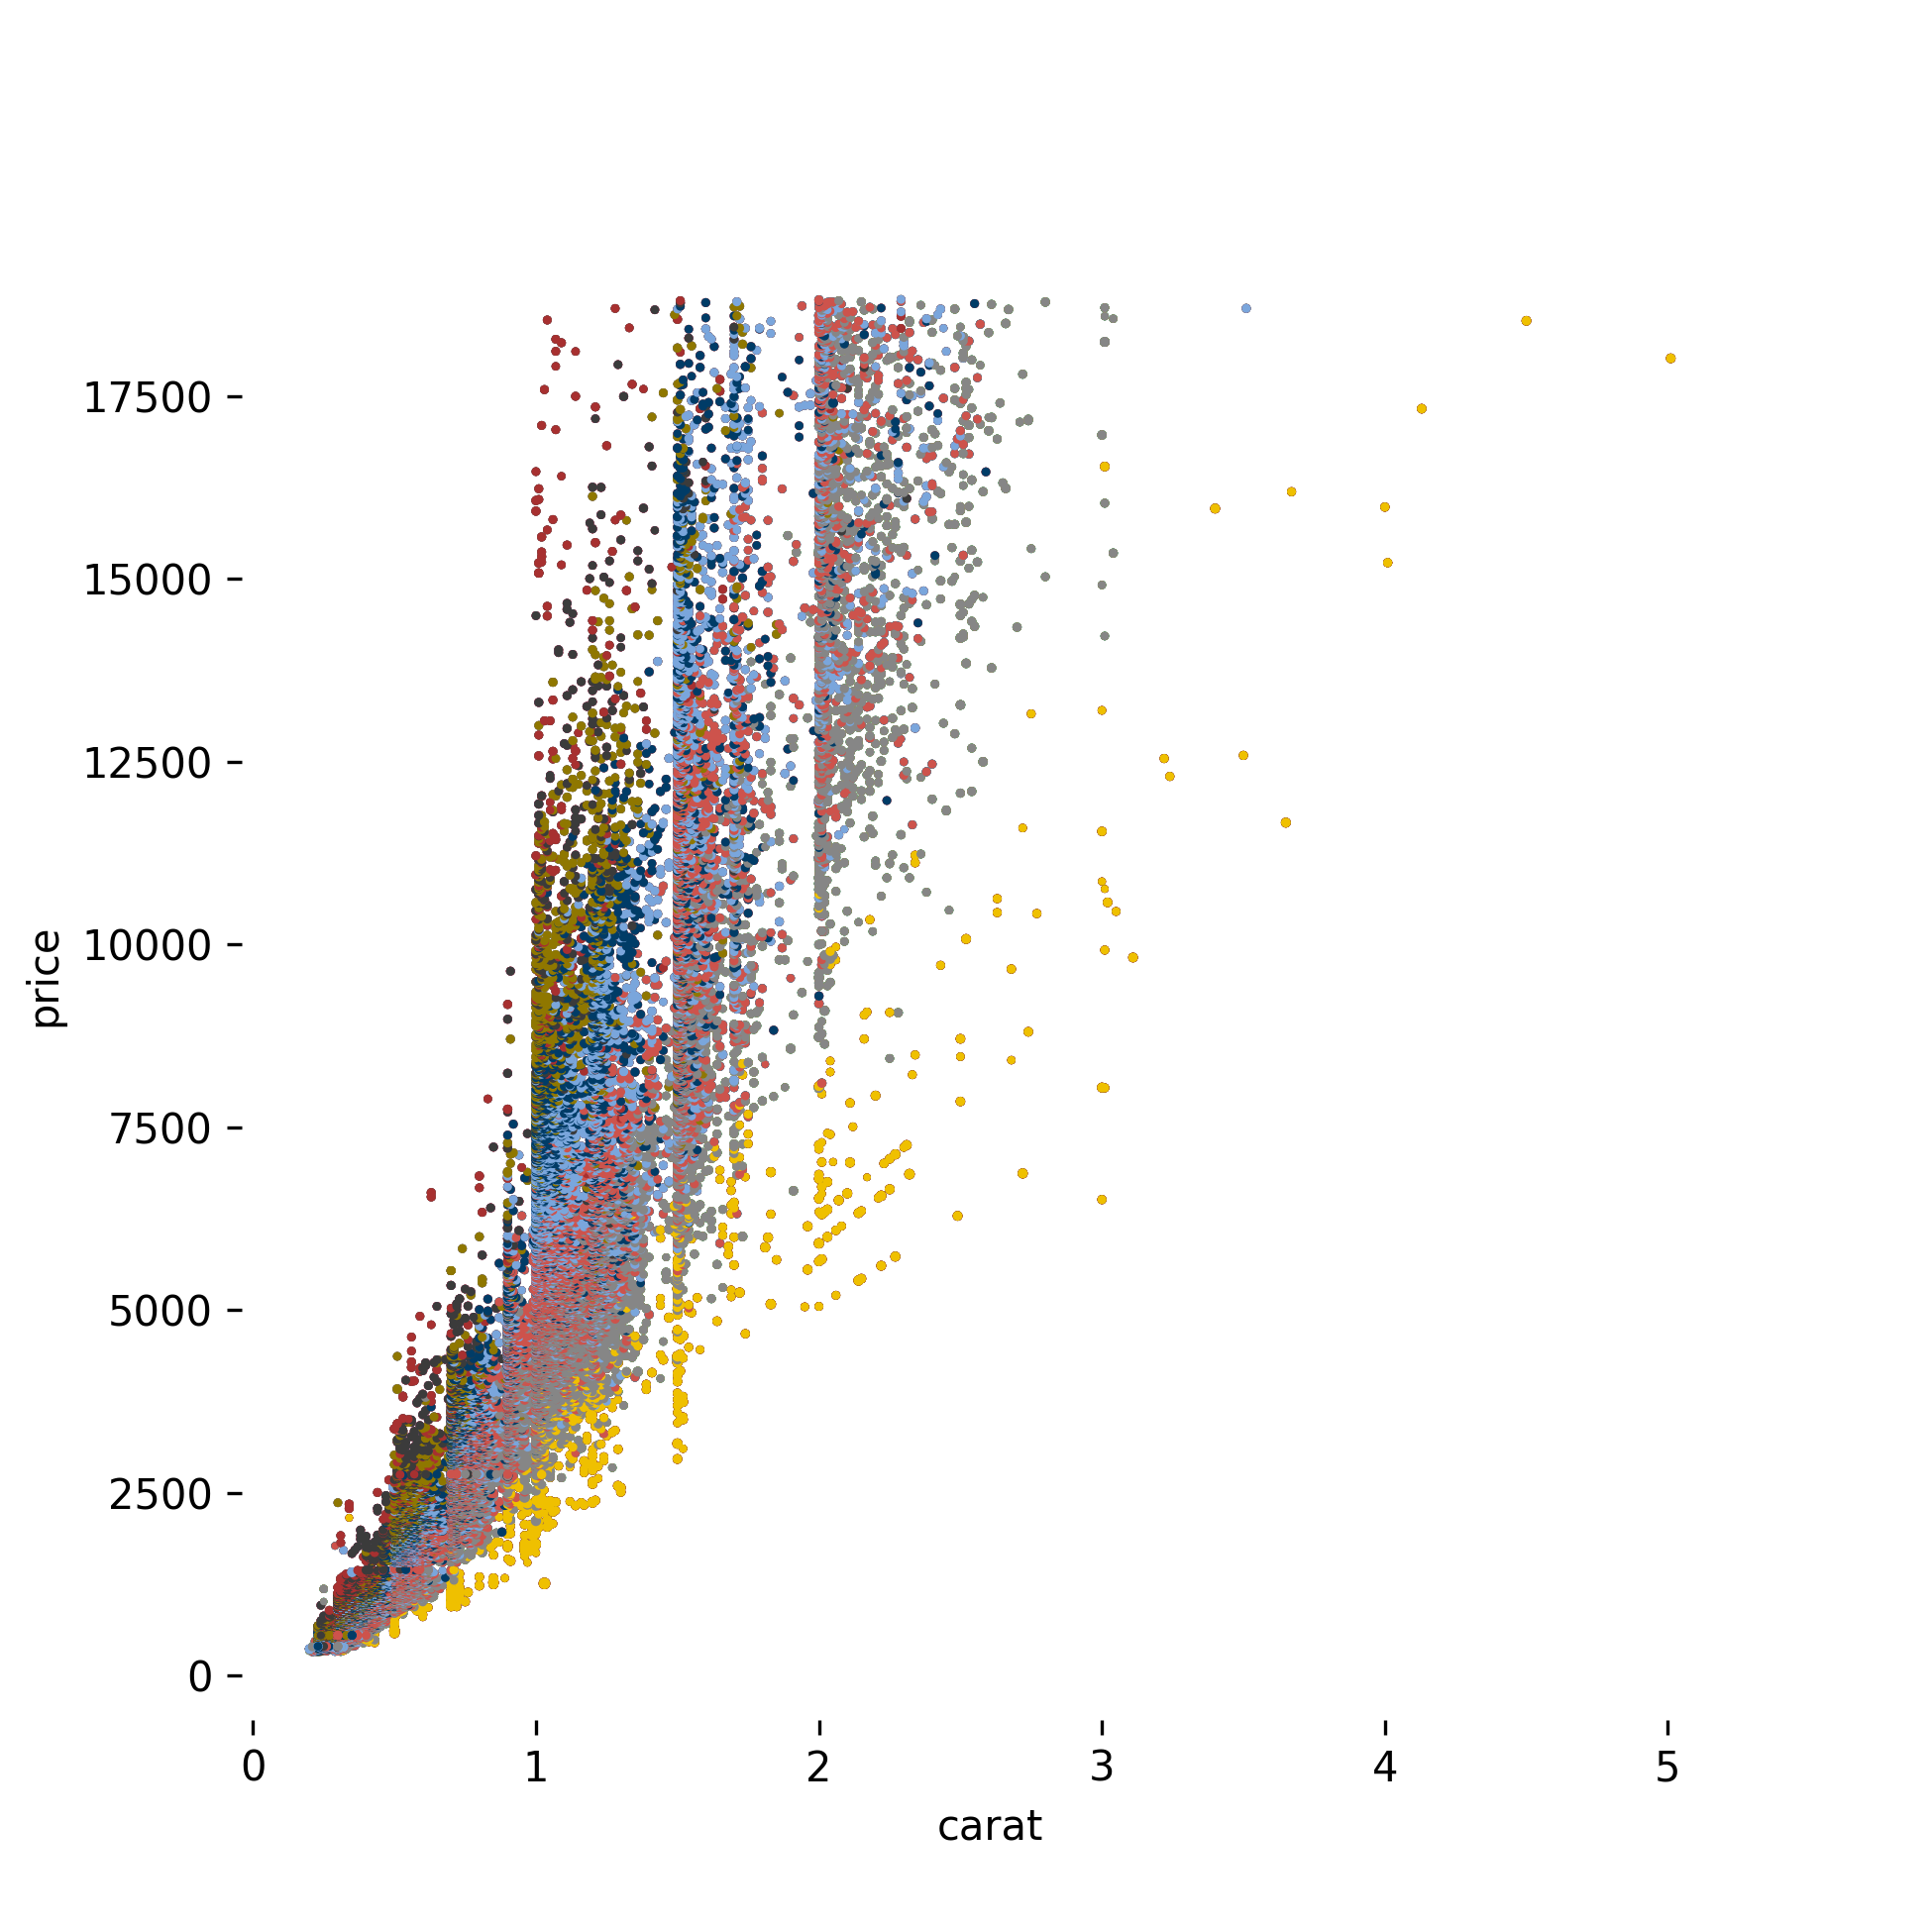
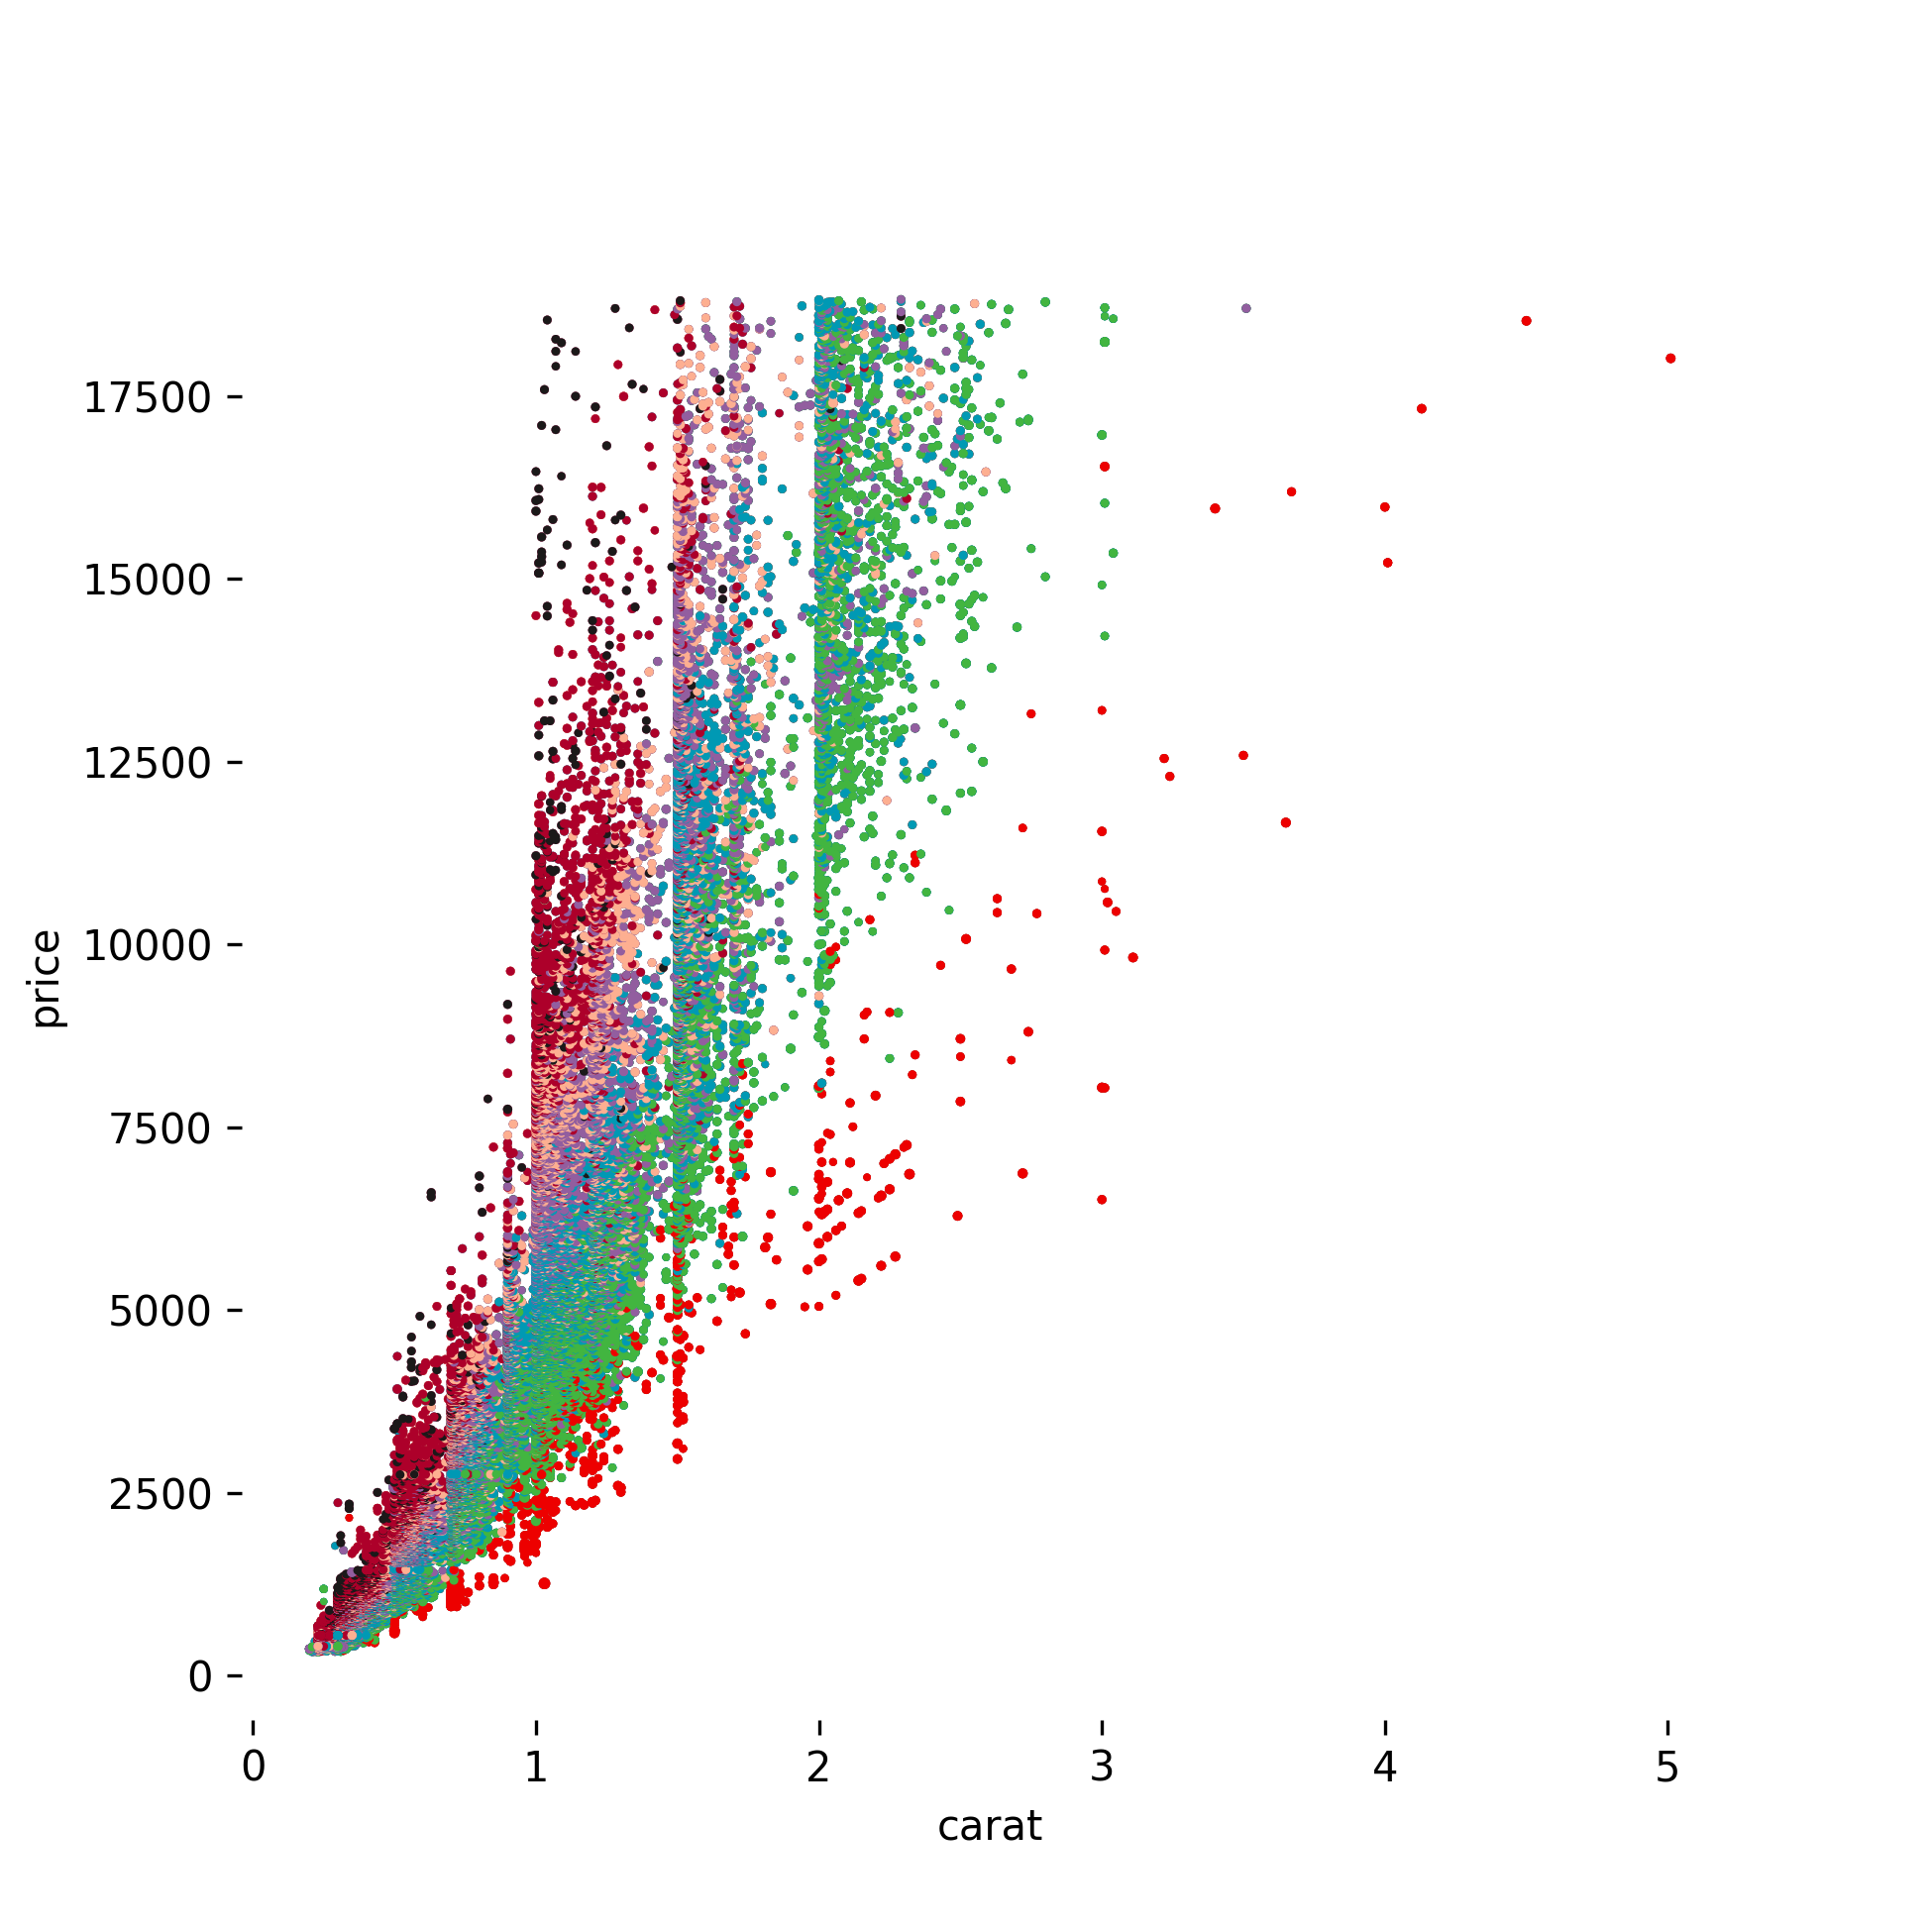
Gallery

展开查看

AAAS

JAMA

NPG

JCO

LANCET

Inspired by the R Package ggsci

Owner
Qingdong Su
Love Python, Love Programming, Love Life.
Qingdong Su
Standardized plots and visualizations in Python

Standardized plots and visualizations in Python pltviz is a Python package for standardized visualization. Routine and novel plotting approaches are f

Andrew Tavis McAllister 0 Jul 09, 2022
Official Matplotlib cheat sheets

Official Matplotlib cheat sheets

Matplotlib Developers 6.7k Jan 09, 2023
This is a place where I'm playing around with pandas to analyze data in a csv/excel file.

pandas-csv-excel-analysis This is a place where I'm playing around with pandas to analyze data in a csv/excel file. 0-start A very simple cheat sheet

Chuqin 3 Oct 05, 2022
A high performance implementation of HDBSCAN clustering. http://hdbscan.readthedocs.io/en/latest/

HDBSCAN Now a part of scikit-learn-contrib HDBSCAN - Hierarchical Density-Based Spatial Clustering of Applications with Noise. Performs DBSCAN over va

Leland McInnes 91 Dec 29, 2022
Small U-Net for vehicle detection

Small U-Net for vehicle detection Vivek Yadav, PhD Overview In this repository , we will go over using U-net for detecting vehicles in a video stream

Vivek Yadav 91 Nov 03, 2022
A program that analyzes data from inertia measurement units installed in aircraft and generates g-exceedance curves.

A program that analyzes data from inertia measurement units installed in aircraft and generates g-exceedance curves.

Pooya 1 Dec 02, 2021
Functions for easily making publication-quality figures with matplotlib.

Data-viz utils 📈 Functions for data visualization in matplotlib 📚 API Can be installed using pip install dvu and then imported with import dvu. You

Chandan Singh 16 Sep 15, 2022
An intuitive library to add plotting functionality to scikit-learn objects.

Welcome to Scikit-plot Single line functions for detailed visualizations The quickest and easiest way to go from analysis... ...to this. Scikit-plot i

Reiichiro Nakano 2.3k Dec 31, 2022
Tweets your monthly GitHub Contributions as Wordle grid

Tweets your monthly GitHub Contributions as Wordle grid

Venu Vardhan Reddy Tekula 5 Feb 16, 2022
WebApp served by OAK PoE device to visualize various streams, metadata and AI results

DepthAI PoE WebApp | Bootstrap 4 & Vue.js SPA Dashboard Based on dashmin (https:

Luxonis 6 Apr 09, 2022
Visualizations of linear algebra algorithms for people who want a deep understanding

Visualising algorithms on symmetric matrices Examples QR algorithm and LR algorithm Here, we have a GIF animation of an interactive visualisation of t

ogogmad 3 May 05, 2022
This Crash Course will cover all you need to know to start using Plotly in your projects.

Plotly Crash Course This course was designed to help you get started using Plotly. If you ever felt like your data visualization skills could use an u

Fábio Neves 2 Aug 21, 2022
Designed a greedy algorithm based on Markov sequential decision-making process in MATLAB/Python to optimize using Gurobi solver

Designed a greedy algorithm based on Markov sequential decision-making process in MATLAB/Python to optimize using Gurobi solver, the wheel size, gear shifting sequence by modeling drivetrain constrai

Sabbella Prasanna 1 Jan 11, 2022
I'm doing Genuary, an aritifiacilly generated month to build code that make beautiful things

Genuary 2022 I'm doing Genuary, an aritifiacilly generated month to build code that make beautiful things. Every day there is a new prompt for making

Joaquín Feltes 1 Jan 10, 2022
view cool stats related to your discord account.

DiscoStats cool statistics generated using your discord data. How? DiscoStats is not a service that breaks the Discord Terms of Service or Community G

ibrahim hisham 5 Jun 02, 2022
Simple spectra visualization tool for astronomers

SpecViewer A simple visualization tool for astronomers. Dependencies Python = 3.7.4 PyQt5 = 5.15.4 pyqtgraph == 0.10.0 numpy = 1.19.4 How to use py

5 Oct 07, 2021
Custom Plotly Dash components based on Mantine React Components library

Dash Mantine Components Dash Mantine Components is a Dash component library based on Mantine React Components Library. It makes it easier to create go

Snehil Vijay 239 Jan 08, 2023
🐍PyNode Next allows you to easily create beautiful graph visualisations and animations

PyNode Next A complete rewrite of PyNode for the modern era. Up to five times faster than the original PyNode. PyNode Next allows you to easily create

ehne 3 Feb 12, 2022
Parallel t-SNE implementation with Python and Torch wrappers.

Multicore t-SNE This is a multicore modification of Barnes-Hut t-SNE by L. Van der Maaten with python and Torch CFFI-based wrappers. This code also wo

Dmitry Ulyanov 1.7k Jan 09, 2023
Machine learning beginner to Kaggle competitor in 30 days. Non-coders welcome. The program starts Monday, August 2, and lasts four weeks. It's designed for people who want to learn machine learning.

30-Days-of-ML-Kaggle 🔥 About the Hands On Program 💻 Machine learning beginner → Kaggle competitor in 30 days. Non-coders welcome The program starts

Roja Achary 145 Jan 01, 2023