termplotlib is a Python library for all your terminal plotting needs.

Overview

termplotlib

PyPi Version PyPI pyversions GitHub stars PyPi downloads

gh-actions codecov LGTM Code style: black

termplotlib is a Python library for all your terminal plotting needs. It aims to work like matplotlib.

Line plots

For line plots, termplotlib relies on gnuplot. With that installed, the code

import termplotlib as tpl
import numpy as np

x = np.linspace(0, 2 * np.pi, 10)
y = np.sin(x)

fig = tpl.figure()
fig.plot(x, y, label="data", width=50, height=15)
fig.show()

produces

    1 +---------------------------------------+
  0.8 |    **     **                          |
  0.6 |   *         **           data ******* |
  0.4 | **                                    |
  0.2 |*              **                      |
    0 |                 **                    |
      |                                   *   |
 -0.2 |                   **            **    |
 -0.4 |                     **         *      |
 -0.6 |                              **       |
 -0.8 |                       **** **         |
   -1 +---------------------------------------+
      0     1    2     3     4     5    6     7

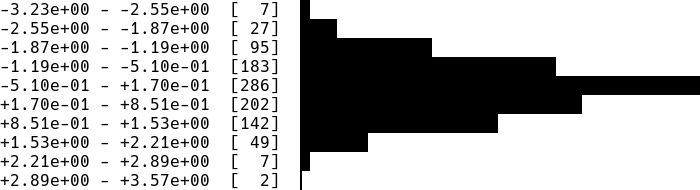
Horizontal histograms

import termplotlib as tpl
import numpy as np

rng = np.random.default_rng(123)
sample = rng.standard_normal(size=1000)
counts, bin_edges = np.histogram(sample)

fig = tpl.figure()
fig.hist(counts, bin_edges, orientation="horizontal", force_ascii=False)
fig.show()

produces

hist1

Horizontal bar charts are covered as well. This

import termplotlib as tpl

fig = tpl.figure()
fig.barh([3, 10, 5, 2], ["Cats", "Dogs", "Cows", "Geese"], force_ascii=True)
fig.show()

produces

Cats   [ 3]  ************
Dogs   [10]  ****************************************
Cows   [ 5]  ********************
Geese  [ 2]  ********

Vertical histograms

import termplotlib as tpl
import numpy as np

rng = np.random.default_rng(123)
sample = rng.standard_normal(size=1000)
counts, bin_edges = np.histogram(sample, bins=40)
fig = tpl.figure()
fig.hist(counts, bin_edges, grid=[15, 25], force_ascii=False)
fig.show()

produces

hist2

Tables

Support for tables has moved over to termtables.

Installation

termplotlib is available from the Python Package Index, so simply do

pip install termplotlib

to install.

Testing

To run the termplotlib unit tests, check out this repository and type

pytest

Similar projects

Comments
  •  width = max([len(line) for c in self._content for line in c]) No content in figure

    width = max([len(line) for c in self._content for line in c]) No content in figure

    import termplotlib as tpl
    import numpy
    
    x = numpy.linspace(0, 2 * numpy.pi, 10)
    y = numpy.sin(x)
    
    fig = tpl.figure()
    fig.plot(x, y, label="data", width=50, height=15)
    fig.show()
    

    after run this piece of code ,there are error ,

    if self._width is None:
    ---> 33             width = max([len(line) for c in self._content for line in c])
         34             width += padding_lr
         35         else:
    

    did you come up with this problem?

    opened by hudengjunai 10
  • Figure.table fails if stdout does not have an `encoding` attribute

    Figure.table fails if stdout does not have an `encoding` attribute

    I ran into this issue when using asciiplotlib in a celery worker where celery replaces sys.stdout with a proxy object called LoggingProxy which does not have an encoding attribute. This seems to be valid as far as the python documentation goes so probably asciiplotlib should check if the attribute exists? The specific line that causes problem

    asciiplotlib/table.py in _get_border_chars at line 31

            border_chars = None
        elif isinstance(border_style, list):
            assert len(border) == 11
            border_chars = border
        else:
            if sys.stdout.encoding in ["UTF-8", "UTF8"] and not force_ascii: # Here
                border_chars = {
                    "thin": ["─", "│", "┌", "┐", "└", "┘", "├", "┤", "┬", "┴", "┼"],
                    "rounded": ["─", "│", "╭", "╮", "╰", "╯", "├", "┤", "┬", "┴", "┼"],
                    "thick": ["━", "┃", "┏", "┓", "┗", "┛", "┣", "┫", "┳", "┻", "╋"],
                    "double": ["═", "║", "╔", "╗", "╚", "╝", "╠", "╣", "╦", "╩", "╬"],
    
    opened by alexjg 7
  • Add float formatting in `barh.py`

    Add float formatting in `barh.py`

    This adds a formatting similar to what is already implemented for the integers when using float in barh :

    Before :

    Water  [3.05]  *************
    Milk   [10.1]  ****************************************
    Juice  [5.00756]  ********************
    

    After:

    Water  [ 3.05000]  *************
    Milk   [10.10000]  ****************************************
    Juice  [ 5.00756]  ********************
    

    Each float value now uses the same width producing a better alignment of the bars.

    Test script:

    import termplotlib as tpl
    data = ([3.05, 10.1, 5.00756], ['Water', 'Milk', 'Juice'])
    fig = tpl.figure()
    fig.barh(*data, force_ascii=True)
    fig.show()
    
    opened by ghost 5
  • Displays meaningless numbers when NaNs are present

    Displays meaningless numbers when NaNs are present

    NaNs seem to mess up asciiplotlib The following:

    import asciiplotlib as apl
    from numpy import arange
    
    fig = apl.figure()
    fig.plot([100,101,102,103,104], [0,1,float("nan"), float("nan"),4])
    fig.show()
    

    Produces:

      120 +-----------+----------+-----------+----------+----------+-----------+
          |                                                                    |
          |                                                                    |
      100 +*******                                                             +
          |  **** ****                                                         |
          |      ***  ****                                                     |
       80 +         ****  ****                                                 +
          |             ****  ****                                             |
          |                 ***   ****                                         |
       60 +                    ****   ***                                      +
          |                        ***   ****                                  |
          |                           ****   ****                              |
          |                               ***    ****                          |
       40 +                                  ****    ****                      +
          |                                      ***     ****                  |
          |                                         ****     ****              |
       20 +                                             ****     ****          +
          |                                                 ***      *         |
          |                                                    ****   *        |
        0 +-----------+----------+-----------+----------+----------**----------+
          0           20         40          60         80        100         120
    

    Interestingly, the x values affect the behavior, too. Using [0,1,2,3,4] for x instead produces a much more innocent-looking plot. Very strange.

    opened by tgbrooks 5
  • FileNotFoundError: [WinError 2] The system cannot find the file specified

    FileNotFoundError: [WinError 2] The system cannot find the file specified

    When trying to run the first example in the readme,

    import asciiplotlib as apl
    import numpy
    
    x = numpy.linspace(0, 2 * numpy.pi, 10)
    y = numpy.sin(x)
    
    fig = apl.figure()
    fig.plot(x, y, label="data", width=50, height=15)
    fig.show()
    

    I get the following error;

    Traceback (most recent call last):
      File "cliplot.py", line 26, in <module>
        fig.plot(x, y, label="data", width=50, height=15)
      File "C:\Users\uqasnosw\AppData\Local\Continuum\Miniconda3\envs\python36\lib\site-packages\asciiplotlib\figure.py", line 63, in plot
        self._content.append(plot(*args, **kwargs))
      File "C:\Users\uqasnosw\AppData\Local\Continuum\Miniconda3\envs\python36\lib\site-packages\asciiplotlib\plot.py", line 24, in plot
        stderr=subprocess.PIPE,
      File "C:\Users\uqasnosw\AppData\Local\Continuum\Miniconda3\envs\python36\lib\subprocess.py", line 709, in __init__
        restore_signals, start_new_session)
      File "C:\Users\uqasnosw\AppData\Local\Continuum\Miniconda3\envs\python36\lib\subprocess.py", line 997, in _execute_child
        startupinfo)
    FileNotFoundError: [WinError 2] The system cannot find the file specified
    

    I'm using Python 3.6 on Windows 10 64-bit.

    opened by aaronsnoswell 5
  • [Question] GPL License

    [Question] GPL License

    Forgive the mundane question but does the GPLv3 allow me to use termplotlib as a dependency in my BSD open-source project? Or does this require re-licensing my project under GPL? This is a fantastic project 👍 good job.

    opened by danieljfarrell 4
  • FileNotFoundError: [WinError 2] The system cannot find the file specified

    FileNotFoundError: [WinError 2] The system cannot find the file specified

    Dear nschloe, your lib sounds nice! I got a different error in that code.. Any idea?

    Traceback (most recent call last):
      File ".\app.py", line 51, in <module>
        fig.plot(x, y)
      File "mypath\env\lib\site-packages\termplotlib\figure.py", line 64, in plot
        self._content.append(plot(*args, **kwargs))
      File "mypath\env\lib\site-packages\termplotlib\plot.py", line 22, in plot
        stderr=subprocess.PIPE,
      File "mypath\appdata\local\programs\python\python37\Lib\subprocess.py", line 800, in __init__
        restore_signals, start_new_session)
      File "mypath\appdata\local\programs\python\python37\Lib\subprocess.py", line 1207, in _execute_child
        startupinfo)
    FileNotFoundError: [WinError 2] The system cannot find the file specified
    
    opened by mscampos92 4
  • Handle strings in horizontal histogram bins

    Handle strings in horizontal histogram bins

    Hello, thank you for making this.

    Long story:

    In my use case I had a Pandas dataframe (DF) containing 1 panda series. This series had been created by resample a two series DF with dates and occurrences

    The resampling is like an histogram binning: it add all occurrences by frequency. e.g (series with dates as index):

    12:00 -> 17
    12:30 -> 21
    13:00 -> 11
    

    (^this is greatly simplified)

    TL;DR

    I want to have something like this:

    2020-04-11 23:00:00  [  28]  ▎
    2020-04-11 23:30:00  [  29]  ▎
    2020-04-12 00:00:00  [1299]  █████████████▌
    2020-04-12 00:30:00  [2637]  ███████████████████████████▍
    2020-04-12 01:00:00  [ 996]  ██████████▍
    2020-04-12 01:30:00  [ 404]  ████▎
    2020-04-12 02:00:00  [ 557]  █████▊
    

    or something like that And maybe be able to format dates

    What I changed

    In my code I needed to change this line https://github.com/nschloe/termplotlib/blob/9827634d1a7049ca430506532bb048241788ad38/termplotlib/hist.py#L48

    to this:

        if show_bin_edges:
            if type(bin_edges[0]) != int:
                labels = [str(d) for d in bin_edges]
            else:
                labels = [
                    "{:+.2e} - {:+.2e}".format(bin_edges[k], bin_edges[k + 1])
                    for k in range(len(bin_edges) - 1)
                ]
    

    (I find it more readable to have just one side of the interval btw)

    Advantage:

    I could provide termplotlib.figure.hist() these equal length "lists":

    counts = DF.series # ≡ list of occurences (or int list)
    bin_edges = DF.series.index # ≡ list of dates
    

    Feature request

    Handle any types of bins dates (e.g. python datetimes; numpy datetimes64, ...) and their formats ?

    As this might be too painful I think the str() could do most of it.

    Thank you for reading Regards

    opened by thenger 4
  • Unittests failing

    Unittests failing

    Does this inly work with Python 3? :(

    ==================================== ERRORS ====================================
    _____________________ ERROR collecting test/test_figure.py _____________________
    ImportError while importing test module '/home/bla/Downloads/asciiplotlib/test/test_figure.py'.
    Hint: make sure your test modules/packages have valid Python names.
    Traceback:
    test/test_figure.py:3: in <module>
        import asciiplotlib as apl
    /usr/local/lib/python2.7/dist-packages/asciiplotlib/__init__.py:14: in <module>
        from .figure import Figure, figure
    /usr/local/lib/python2.7/dist-packages/asciiplotlib/figure.py:5: in <module>
        from .table import table
    /usr/local/lib/python2.7/dist-packages/asciiplotlib/table.py:3: in <module>
        from collections.abc import Sequence
    E   ImportError: No module named abc
    
    opened by benlarsendk 4
  • IndexError: list index out of range error in vertical hist

    IndexError: list index out of range error in vertical hist

    Amazing lib thanx alot @nschloe !

    I am facing the following error (I am also pasting the arrays i am using for histogram and bins that might help you i guess):

    Traceback (most recent call last):
      File "paura_lite.py", line 30, in <module>
        fig.hist(X2, freqs2, grid=[25, 25], force_ascii=False)
      File "/usr/local/lib/python3.6/site-packages/termplotlib/figure.py", line 56, in hist
        self._content.append(hist(*args, **kwargs))
      File "/usr/local/lib/python3.6/site-packages/termplotlib/hist.py", line 22, in hist
        force_ascii=force_ascii,
      File "/usr/local/lib/python3.6/site-packages/termplotlib/hist.py", line 123, in hist_vertical
        if row[pos] == 8 and (pos + 1 == len(row) or row[pos + 1] > 0):
    IndexError: list index out of range
    

    X2 and freqs2 are respectively (plotting the same arrays with either plot or horizontal histogram works just fine fyi

    [124.41883839  35.41717879  31.53559882  28.65272995  21.51772978
      18.91799348  17.13384018  16.4547271   15.12907567  12.27610031
      12.89634676  10.55464499  10.1385237    9.76782805   8.12663877
       7.21406045   5.71375229   4.28627088   3.3031431    2.84735662]
    [   0.  200.  400.  600.  800. 1000. 1200. 1400. 1600. 1800. 2000. 2200.
     2400. 2600. 2800. 3000. 3200. 3400. 3600. 3800. 4000.]
    
    
    opened by tyiannak 3
  • widht and height arguments of plot non working?

    widht and height arguments of plot non working?

    Hello, I just discovered this lib, this is very useful for servers without graphical interface! thanks a lot for the work.

    I just can't make the widht and height arguments of plot function work :

    (python 3.7.3)

    >>> prof
    array([-2.        , -2.        , -1.77777778, -1.77777778, -1.55555556,
           -1.55555556, -1.33333333, -1.33333333, -1.11111111, -1.11111111,
           -0.88888889, -0.88888889, -0.66666667, -0.66666667, -0.44444444,
           -0.44444444, -0.22222222, -0.22222222, -0.        , -0.        ,
            0.        ,  0.        ,  0.22222222,  0.22222222,  0.44444444,
            0.44444444,  0.66666667,  0.66666667,  0.88888889,  0.88888889,
            1.11111111,  1.11111111,  1.33333333,  1.33333333,  1.55555556,
            1.55555556,  1.77777778,  1.77777778,  2.        ,  2.        ])
    >>> fig = tplt.figure()
    >>> fig.plot(range(len(prof)), prof, width=len(prof), height=20)
    >>> fig.show()
    
        2 +--------+-------+--------+--------+-------+--------+-------+----***-+
          |                                                            ****    |
      1.5 +                                                         ***        +
          |                                                     ****           |
          |                                                  ***               |
        1 +                                               ***                  +
          |                                           ****                     |
      0.5 +                                        ***                         +
          |                                    ****                            |
        0 +                              ******                                +
          |                             *                                      |
          |                          ***                                       |
     -0.5 +                      ****                                          +
          |                   ***                                              |
       -1 +                ***                                                 +
          |            ****                                                    |
          |         ***                                                        |
     -1.5 +     ****                                                           +
          |  ***                                                               |
       -2 ***------+-------+--------+--------+-------+--------+-------+--------+
          0        5       10       15       20      25       30      35       40
    

    It seems that the plot uses the defaut values for widht and height of the figure. Maybe I did something wrong?

    opened by TitouanGendron 3
  • Add headers for user readability

    Add headers for user readability

    The horizontal view is useful if we're aware of the context (category, count) but it's missing the context of headers for application users.

    Right now, I imagine the user has to get that working

    Instead of just this,

    Cats   [ 3]  ************
    Dogs   [10]  ****************************************
    Cows   [ 5]  ********************
    Geese  [ 2]  ********
    

    add a header:

    Animals  Count
    Cats     [ 3]   ************
    Dogs     [10]   ****************************************
    Cows     [ 5]   ********************
    Geese    [ 2]   ********
    
    opened by deeTEEcee 0
Releases(v0.3.9)
Owner
Nico Schlömer
Mathematics, numerical analysis, scientific computing, Python. Always interested in new problems.
Nico Schlömer
Create a visualization for Trump's Tweeted Words Using Python

Data Trump's Tweeted Words This plot illustrates twitter word occurences. We already did the coding I needed for this plot, so I was very inspired to

7 Mar 27, 2022
FURY - A software library for scientific visualization in Python

Free Unified Rendering in Python A software library for scientific visualization in Python. General Information • Key Features • Installation • How to

169 Dec 21, 2022
A workshop on data visualization in Python with notebooks and exercises for following along.

Beyond the Basics: Data Visualization in Python The human brain excels at finding patterns in visual representations, which is why data visualizations

Stefanie Molin 162 Dec 05, 2022
Runtime analysis of code with plotting

Runtime analysis of code with plotting A quick comparison among Python, Cython, and the C languages A Programming Assignment regarding the Programming

Cena Ashoori 2 Dec 24, 2021
Automatic data visualization in atom with the nteract data-explorer

Data Explorer Interactively explore your data directly in atom with hydrogen! The nteract data-explorer provides automatic data visualization, so you

Ben Russert 65 Dec 01, 2022
:art: Diagram as Code for prototyping cloud system architectures

Diagrams Diagram as Code. Diagrams lets you draw the cloud system architecture in Python code. It was born for prototyping a new system architecture d

MinJae Kwon 27.5k Dec 30, 2022
Script to create an animated data visualisation for categorical timeseries data - GIF choropleth map with annotations.

choropleth_ldn Simple script to create a chloropleth map of London with categorical timeseries data. The script in main.py creates a gif of the most f

1 Oct 07, 2021
3D-Lorenz-Attractor-simulation-with-python

3D-Lorenz-Attractor-simulation-with-python Animação 3D da trajetória do Atrator de Lorenz, implementada em Python usando o método de Runge-Kutta de 4ª

Hevenicio Silva 17 Dec 08, 2022
GD-UltraHack - A Mod Menu for Geometry Dash. Specifically a MegahackV5 clone in Python. Only for Windows

GD UltraHack: The Mod Menu that Nobody asked for. This is a mod menu for the gam

zeo 1 Jan 05, 2022
Piglet-shaders - PoC of custom shaders for Piglet

Piglet custom shader PoC This is a PoC for compiling Piglet fragment shaders usi

6 Mar 10, 2022
Insert SVGs into matplotlib

Insert SVGs into matplotlib

Andrew White 35 Dec 29, 2022
Leyna's Visualizing Data With Python

Leyna's Visualizing Data Below is information on the number of bilingual students in three school districts in Massachusetts. You will also find infor

11 Oct 28, 2021
Homework 2: Matplotlib and Data Visualization

Homework 2: Matplotlib and Data Visualization Overview These data visualizations were created for my introductory computer science course using Python

Sophia Huang 12 Oct 20, 2022
An easy to use burndown chart generator for GitHub Project Boards.

Burndown Chart for GitHub Projects An easy to use burndown chart generator for GitHub Project Boards. Table of Contents Features Installation Assumpti

Joseph Hale 15 Dec 28, 2022
A python script and steps to display locations of peers connected to qbittorrent

A python script (along with instructions) to display the locations of all the peers your qBittorrent client is connected to in a Grafana worldmap dash

62 Dec 07, 2022
A tool for automatically generating 3D printable STLs from freely available lidar scan data.

mini-map-maker A tool for automatically generating 3D printable STLs from freely available lidar scan data. Screenshots Tutorial To use this script, g

Mike Abbott 51 Nov 06, 2022
Here I plotted data for the average test scores across schools and class sizes across school districts.

HW_02 Here I plotted data for the average test scores across schools and class sizes across school districts. Average Test Score by Race This graph re

7 Oct 27, 2021
Some examples with MatPlotLib library in Python

MatPlotLib Example Some examples with MatPlotLib library in Python Point: Run files only in project's directory About me Full name: Matin Ardestani Ag

Matin Ardestani 4 Mar 29, 2022
Machine learning beginner to Kaggle competitor in 30 days. Non-coders welcome. The program starts Monday, August 2, and lasts four weeks. It's designed for people who want to learn machine learning.

30-Days-of-ML-Kaggle 🔥 About the Hands On Program 💻 Machine learning beginner → Kaggle competitor in 30 days. Non-coders welcome The program starts

Roja Achary 145 Jan 01, 2023
Some useful extensions for Matplotlib.

mplx Some useful extensions for Matplotlib. Contour plots for functions with discontinuities plt.contour mplx.contour(max_jump=1.0) Matplotlib has pro

Nico Schlömer 519 Dec 30, 2022