当前位置:网站首页>R language cluster analysis - code analysis
R language cluster analysis - code analysis
2022-08-10 06:13:00 【Ape Tongxue】
+(1)实验数据:iris鸢尾花数据
datd(iris)
head(iris)
Sepal.Length Sepal.Width Petal.Length Petal.Width Species
1 5.1 3.5 1.4 0.2 setosa
2 4.9 3.0 1.4 0.2 setosa
3 4.7 3.2 1.3 0.2 setosa
4 4.6 3.1 1.5 0.2 setosa
5 5.0 3.6 1.4 0.2 setosa
6 5.4 3.9 1.7 0.4 setosa
data()function to load dataset
head()Function to view the first few rows of data,How many lines to fill in brackets,默认6行
table(iris$Species)
setosa versicolor virginica
50 50 50
table()函数查看"Species"The number of occurrences of the three values
set.seed(1234)
kmeansObj <-kmeans(iris[,-5],centers=3)
print(kmeansObj)
K-means clustering with 3 clusters of sizes 50, 62, 38
Cluster means:
Sepal.Length Sepal.Width Petal.Length Petal.Width
1 5.006000 3.428000 1.462000 0.246000
2 5.901613 2.748387 4.393548 1.433871
3 6.850000 3.073684 5.742105 2.071053
Clustering vector:
[1] 1 1 1 1 1 1 1 1 1 1 1 1 1 1 1 1 1 1 1 1 1 1 1 1 1 1 1 1 1 1 1 1 1 1 1 1
[37] 1 1 1 1 1 1 1 1 1 1 1 1 1 1 2 2 3 2 2 2 2 2 2 2 2 2 2 2 2 2 2 2 2 2 2 2
[73] 2 2 2 2 2 3 2 2 2 2 2 2 2 2 2 2 2 2 2 2 2 2 2 2 2 2 2 2 3 2 3 3 3 3 2 3
[109] 3 3 3 3 3 2 2 3 3 3 3 2 3 2 3 2 3 3 2 2 3 3 3 3 3 2 3 3 3 3 2 3 3 3 2 3
[145] 3 3 2 3 3 2
Within cluster sum of squares by cluster:
[1] 15.15100 39.82097 23.87947
(between_SS / total_SS = 88.4 %)
Available components:
[1] "cluster" "centers" "totss" "withinss"
[5] "tot.withinss" "betweenss" "size" "iter"
[9] "ifault"
set.seed(1234):设置随机数种子,Make experimental results reproducible.Values in parentheses are arbitrary,is to mark the random number drawn.The same sample can be drawn next time.
kmeans():做K均值聚类.
第一个参数,是数据集,Here we use slicing method to extract data,This removes the categorySpecies.
Let's talk about slices
df[,],默认所以,全部,[,]表示 [行,列]
df[1,],取第一行,所以列
df[,1],取所有行,第一列
df[-1,],Delete after the first line,take all the columns
df[,-1],删除第一列后,fetch all rows
第二个参数centers,表示簇的数量,i.e. how many classes,设置为3
Other parameters are introduced at the end
The following analysis of the output results:
(1)K-means clustering with 3 clusters of sizes 50, 62, 38
representing three groupsK-Classification of mean clustering,第一个类为50个样本,第二个有62个样本,The third is38个样本.
(2)Cluster means:
The final average generated by the individual column values in each cluster
(3)Clustering vector:
The cluster to which each row of records belongs(2represents belonging to the second cluster,1represents belonging to the first cluster,3represents belonging to the third cluster)
(4)Within cluster sum of squares by cluster:
sum of squared distances within each cluster
(5)Available components:
运行kmeansThe various components contained in the object returned by the function
(6)Available components:
运行kmeansThe various components contained in the object returned by the function
meaning of part:
“cluster”是一个整数向量,Used to indicate the cluster to which the record belongs
“centers”是一个矩阵,represents the center point of each variable in each cluster
“totss”represents the overall sum of squared distances for the clusters generated
“withinss”represents the sum of squared distances within each cluster group
“tot.withinss”Represents the total sum of squared distances within a cluster group
“betweenss”Indicates the total sum of squares of clusters between cluster groups
“size”represents the number of members in each clustering group
So how do we check?
如:
kmeansObj$totss
kmeansObj$betweenss
即可进行查看
And how are the above values calculated??
(查过很多资料,Don't say how to calculate,only literal interpretation,那不行啊)
The above case data is too large to introduce
接下来,I use a simple dataset to explain,make the literal meaning clearer
> df <- data.frame(x=c(0,0,1.5,5,5),y=c(2,0,0,0,2))
> km <- kmeans(df[,-2],centers=2)
> print(km)输出:
K-means clustering with 2 clusters of sizes 3, 2
Cluster means:
[,1]
1 0.5
2 5.0Clustering vector:
[1] 1 1 1 2 2Within cluster sum of squares by cluster:
[1] 1.5 0.0
(between_SS / total_SS = 94.2 %)Available components:
[1] "cluster" "centers" "totss" "withinss" "tot.withinss"
[6] "betweenss" "size" "iter" "ifault"> print(df)
x y
1 0.0 2
2 0.0 0
3 1.5 0
4 5.0 0
5 5.0 2解释:
K-means clustering with 2 clusters of sizes 3, 2
使用K-means算法以2为参数,把5data objects are divided into2个聚类,Make sure clusters have high similarity,The lower the degree of similarity between clustering.
First use Euclid's theorem to classify:求出5class distance
1与2的距离:0
1与3的距离:1.5
1与4的距离:5
1与5的距离:5
2与3的距离:1.5
2与4的距离:5
2与5的距离:5
3与4的距离:3.5
3与5的距离:3.5
4与5的距离:0
to be divided into two categories,所以1与2一类,4和5一类,3到1、2为1.5,到4、5为3.5,所以和1、2、一类
C1(1、2、3),C2(4,5)
Cluster means:
[,1]
1 0.5
2 5.0
The final average generated by the individual column values in each cluster
1:
2:
Within cluster sum of squares by cluster:
[1] 1.5 0.0sum of squared distances within each cluster
1.5:
什么意思呢?就是1、2same to3的距离的平方和
0.0:4到5的距离为0


 什么意思呢?就是1、2same to3的距离的平方和
(4)评估k均值聚类结果
table(kmeansObj$cluster,iris$Species)
setosa versicolor virginica
1 50 0 0
2 0 48 14
3 0 2 36
This is similar to the confusion matrix,The difference is that the real here is listed,Prediction is OK
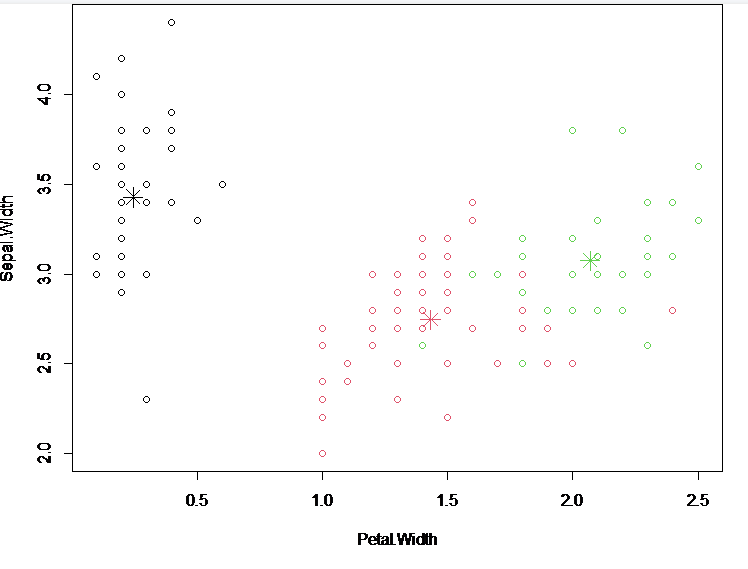
(5)可视化k均值聚类结果
par(mar=c(4,4,0.1,0.1))
plot(iris[c("Petal.Width","Sepal.Width")],col = kmeansObj$cluster)
points(kmeansObj$centers[,c("Petal.Width","Sepal.Width")],col =1:3,pch=8,cex=2)
par()function to set drawing parameters
mar参数:Graphic Margin Parameters(下,左,上,右)
plot()function to draw a scatter plot
col参数:符号和颜色,Here, put the cluster into the representation to represent the three color types
points()Add points and set properties
(6)do hierarchical clustering
set.seed(1234)
idx <- sample(1:dim(iris)[1],40)
irisSample <-iris[idx,]
hc <-hclust(dist(irisSample[,-5]),method = "average")
print(hc)
Call:
hclust(d = dist(irisSample[, -5]), method = "average")
Cluster method : average
Distance : euclidean
Number of objects: 40 
groups <- cutree(hc,k = 3)
table(groups,iris$Species[idx])
groups setosa versicolor virginica
1 12 0 0
2 0 12 10
3 0 0 6
边栏推荐
猜你喜欢


随机推荐
碳酸锂、碳酸氢锂溶液除钙镁离子工艺原理
pytorch-10. Convolutional Neural Networks (homework)
手把手教你改内核源码--sysfs虚拟文件系统2
8个问题轻松掌握Unity前向渲染
动态规划、背包问题 6/24 106-110
中间件-Rocktmq
探究乱码问题的本源:GBK,UTF8,UTF16,UTF8BOM,ASN1之间的关联
工业废酸回收工艺
剑指 Offer(第 2 版)7/7 14-17
初学者也能看懂的Ray March体积云
优先级队列,大小顶堆PriorityQueue
开源游戏服务器框架NoahGameFrame(NF)服务器端环境搭建(二)
二叉树 6/15 76-80
STM32单片机OLED俄罗斯方块单片机小游戏
从交换两数据值看指针的使用(c语言实现)
自定义View的流程总结学习
markdown类图学习
【fiddler4】使用fiddler设置简单并发
STM32F407ZG 看门狗 IWDG & WWDG
所有文章汇总目录