当前位置:网站首页>[data mining] use Excel to mine the equity relationship and count the distribution and trend of different types of kinship in listed companies according to the year [visual presentation]
[data mining] use Excel to mine the equity relationship and count the distribution and trend of different types of kinship in listed companies according to the year [visual presentation]
2022-04-22 10:43:00 【Hua Weiyun】
Personal profile :brief introduction : Junior is reading , Share some learning notes and experience
Areas of interest :Python, Artificial intelligence , Algorithms and data structures
Maxim : stream , move forward , or you 'll fall behind !
Purpose : Progress together !
hello ! Hello, everyone. I'm 【 Nanpengyou 】, You can also call me Xiaoyou , Little friend , Xiaoyou, wait
If there's something wrong , Welcome to correct. In addition, if you think it's good, please support the blogger in the third company
Welcome to the big guys

A few days ago, my friend asked me to help him mine the data , Please treat me to delicious food when it's ready 🤩🤩 Although not, you can't lose face !( Not for delicious food ) Just try to use Python Did a little .
Probably require :
1、 database , Is a given set of raw data ;
2、 Mining databases “ Relationship details ” Medium “ spouse / spouse 、 Brothers and sisters 、 Father and son 、 Father and daughter 、 Mother and son 、 mother and daughter ” Specific information ;
3、 The excavated information is sorted into 【 Example 】 In the format ;
Be careful :
1) A securities code corresponds to multiple years ;
2) The company under the securities code has some kind of relationship marked as 1, There is no correspondence, marked as 0.
3) The distribution and trend of different types of kinship in listed companies are counted according to the year 【 Visual presentation - Free choice 】.

data :

I looked at about 100000 !
Originally wanted to simply use Python Run the , Look at the effect , But I gave up without a result in a few minutes !( The reason is that I don't have good skills )
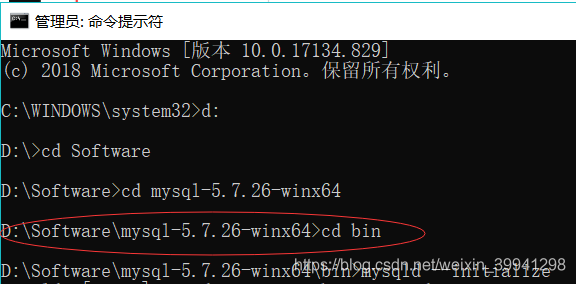
So I use Excel Table data mining .
Method :
First step : Year of extraction .
Create a new year column , Click the space under the year , Input function
=YEAR(B2)
Extract the year in the statistics deadline
Just double click the cross below , The year column is completed !

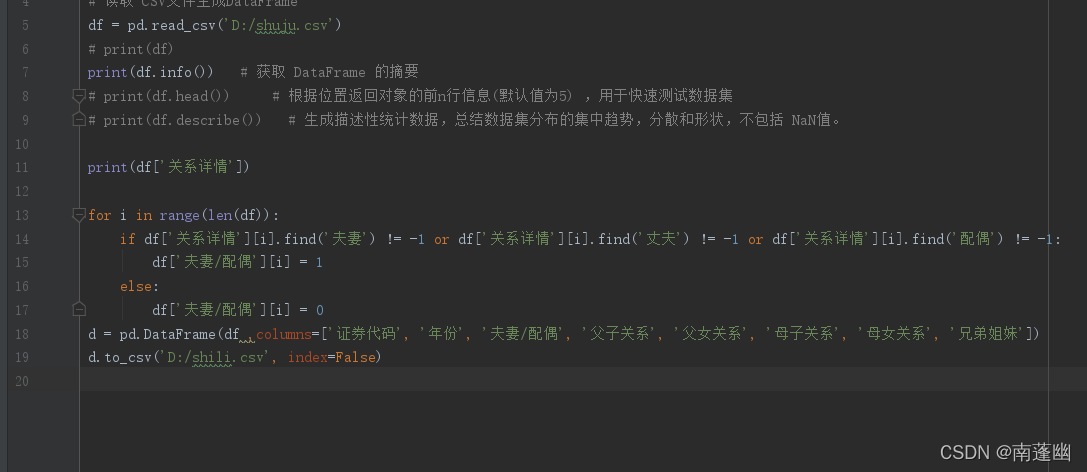
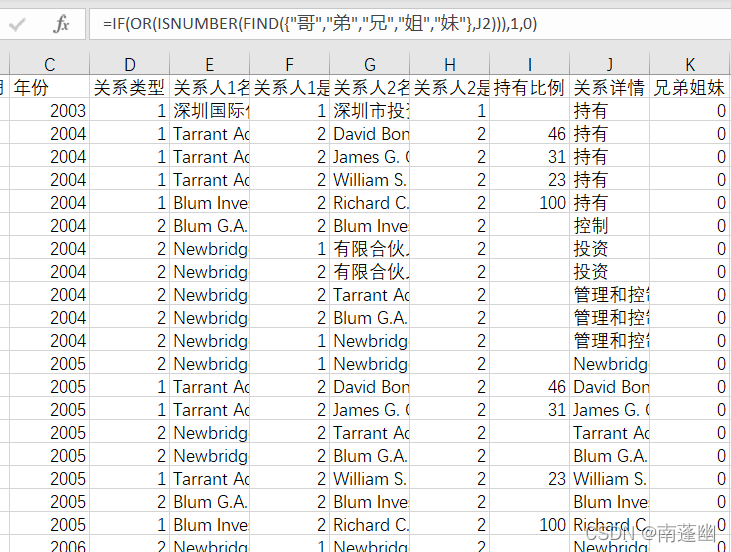
The second step , Judge the relationship between shareholders
Enter the function... In the space under the closed series
=IF(OR(ISNUMBER(FIND({“ Brother ”,“ brother ”,“ Brother ”,“ The elder sister ”,“ Sister ”},J2))),1,0)
Determine whether the relationship details contain characters such as elder brother or the first or elder sister or younger sister , If included, it is 1, Not included is 0
Other similar input corresponding functions
=IF(OR(ISNUMBER(FIND({“ spouse ”,“ Her husband, ”,“ Wife ”},J2))),1,0)
spouse
=IF(AND(ISNUMBER(FIND({“ Father ”,“ Son ”},J2))),1,0)
Father and son
=IF(AND(ISNUMBER(FIND({“ Father ”,“ Woman ”},J2))),1,0)
Father and daughter
=IF(AND(ISNUMBER(FIND({“ mother ”,“ Son ”},J2))),1,0)
Mother and son
=IF(AND(ISNUMBER(FIND({“ mother ”,“ Woman ”},J2))),1,0)
mother and daughter
Because of the amount of data , I didn't look at them one by one , There may be something similar to who is whose eldest son , Who is whose son-in-law has not been extracted
In this way, the relationship between shareholders is extracted .
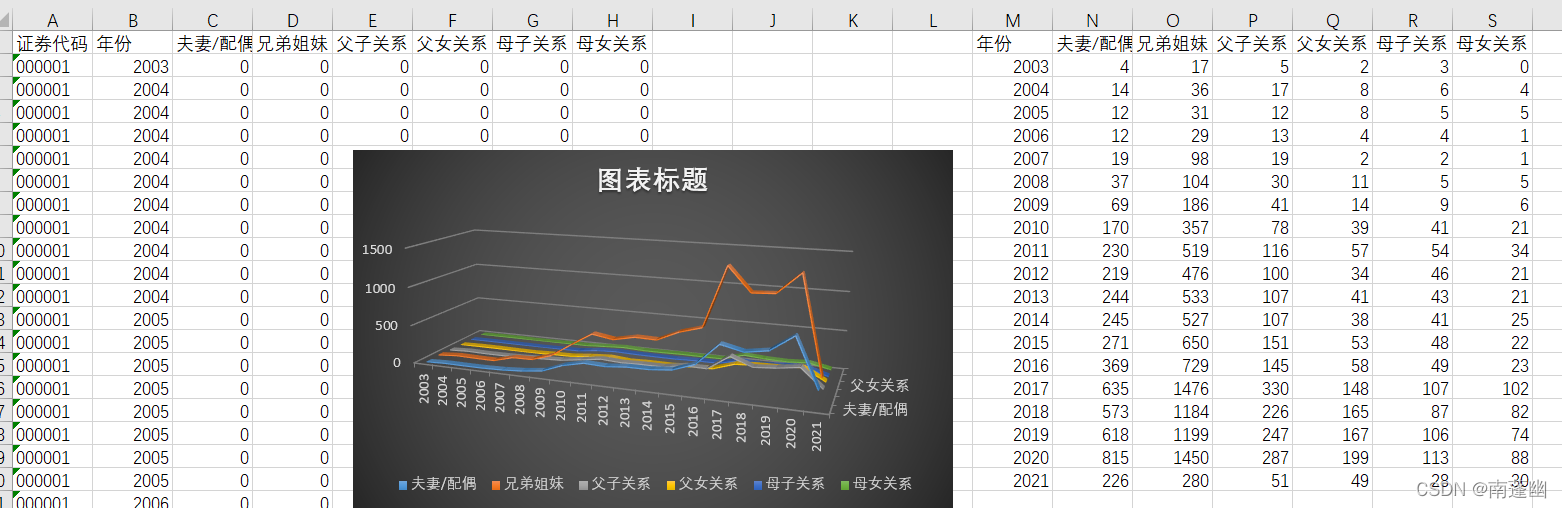
The third step , Make statistics

Similarly, we also use functions !
Count the total number of different relationships of shareholders in each year according to the year
The first blank under each column relationship , Enter the following functions respectively
=SUMIF(C2:C199673,T2,L2:L199673)
=SUMIF(C2:C199673,T2,K2:K199673)
=SUMIF(C2:C199673,T2,M2:M199673)
=SUMIF(C2:C199673,T2,N2:N199673)
=SUMIF(C2:C199673,T2,O2:O199673)
=SUMIF(C2:C199673,T2,P2:P199673)
The functionality , Judge whether the year in the year column is equal to the corresponding year , If equal, the relationships in the corresponding rows are added and summed
result :

Step four , Make a chart
It was done here , But I think it will be more interesting if it is made dynamic !
But if you type in code , Some trouble , And need some programming foundation .
Recommend an online dynamic map making website
Flourish
You can make beautiful dynamic charts without programming foundation
First prepare a Excel surface , Input statistics
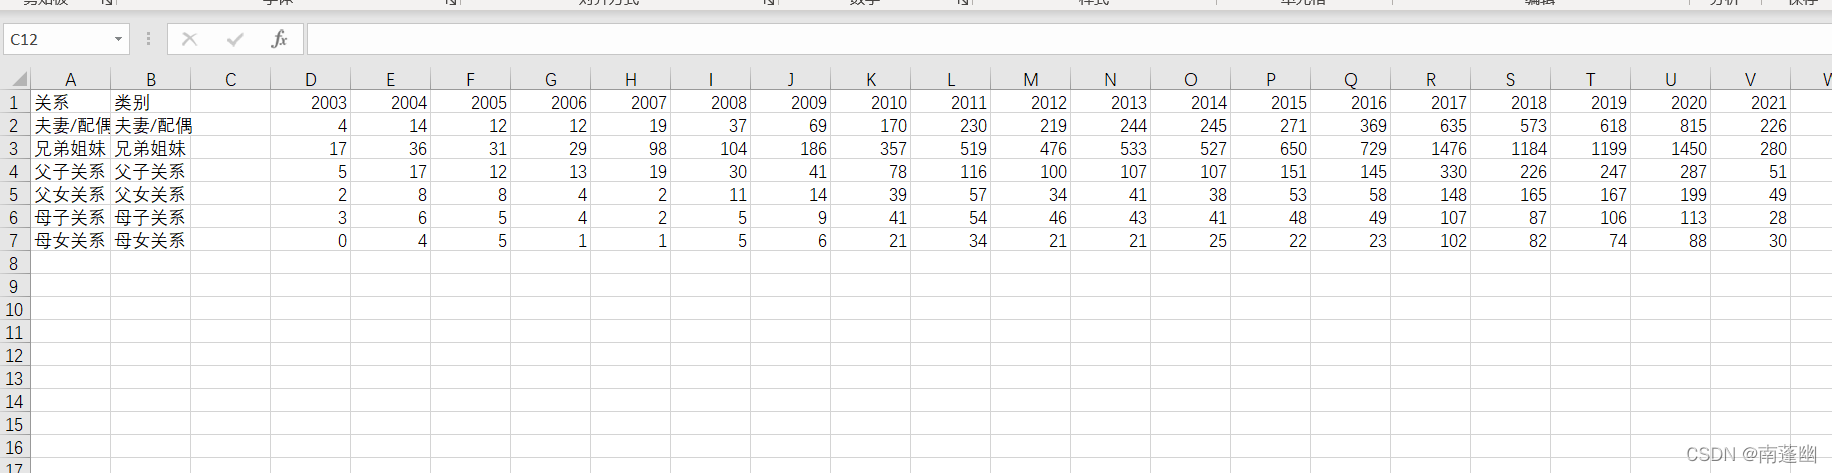
Go to the website
Dynamic chart of equity relationship

Just upload the data !
You can also adjust the color according to your preferences , Size, etc
Is it convenient , My friend thinks it's cool ! Very satisfied !
And it can release ! You can let others download and access !
Edit a HTML file
<!DOCTYPE html><html lang="en"><head> <meta charset="UTF-8"> <meta http-equiv="X-UA-Compatible" content="IE=edge"> <meta name="viewport" content="width=device-width, initial-scale=1.0"> <title>Document</title></head><body> <div class="flourish-embed flourish-bar-chart-race" data-src="visualisation/9458106"><script src="https://public.flourish.studio/resources/embed.js"></script></div></body></html> Send it to a friend , You can access it remotely !

summary :
It doesn't work Python Make it out , But also mastered Excel Methods !

版权声明
本文为[Hua Weiyun]所创,转载请带上原文链接,感谢
https://yzsam.com/2022/04/202204221033310368.html
边栏推荐
- OneFlow学习笔记:从Functor到OpExprInterpreter
- 084使用CVE-2017-7494漏洞实现Samba远程代码执行
- Use of navigationview
- Eval description
- Qt关于信号槽连接出现的一些问题记录
- A simple PLC motion control project
- Oracle account is locked. Unlocking method
- 基于PyQt5实现数据动态可视化
- ffmpeg filtergraph同时添加缩放和osd滤镜
- About the problem that the picture library of tpshop open source mall version 6.0 does not display pictures
猜你喜欢

OneFlow學習筆記:從Functor到OpExprInterpreter
![[leetcode] the first mock exam of two tree traversal iteration method.](/img/2a/4fb0de0f001738729a0051c14a1e5d.jpg)
[leetcode] the first mock exam of two tree traversal iteration method.
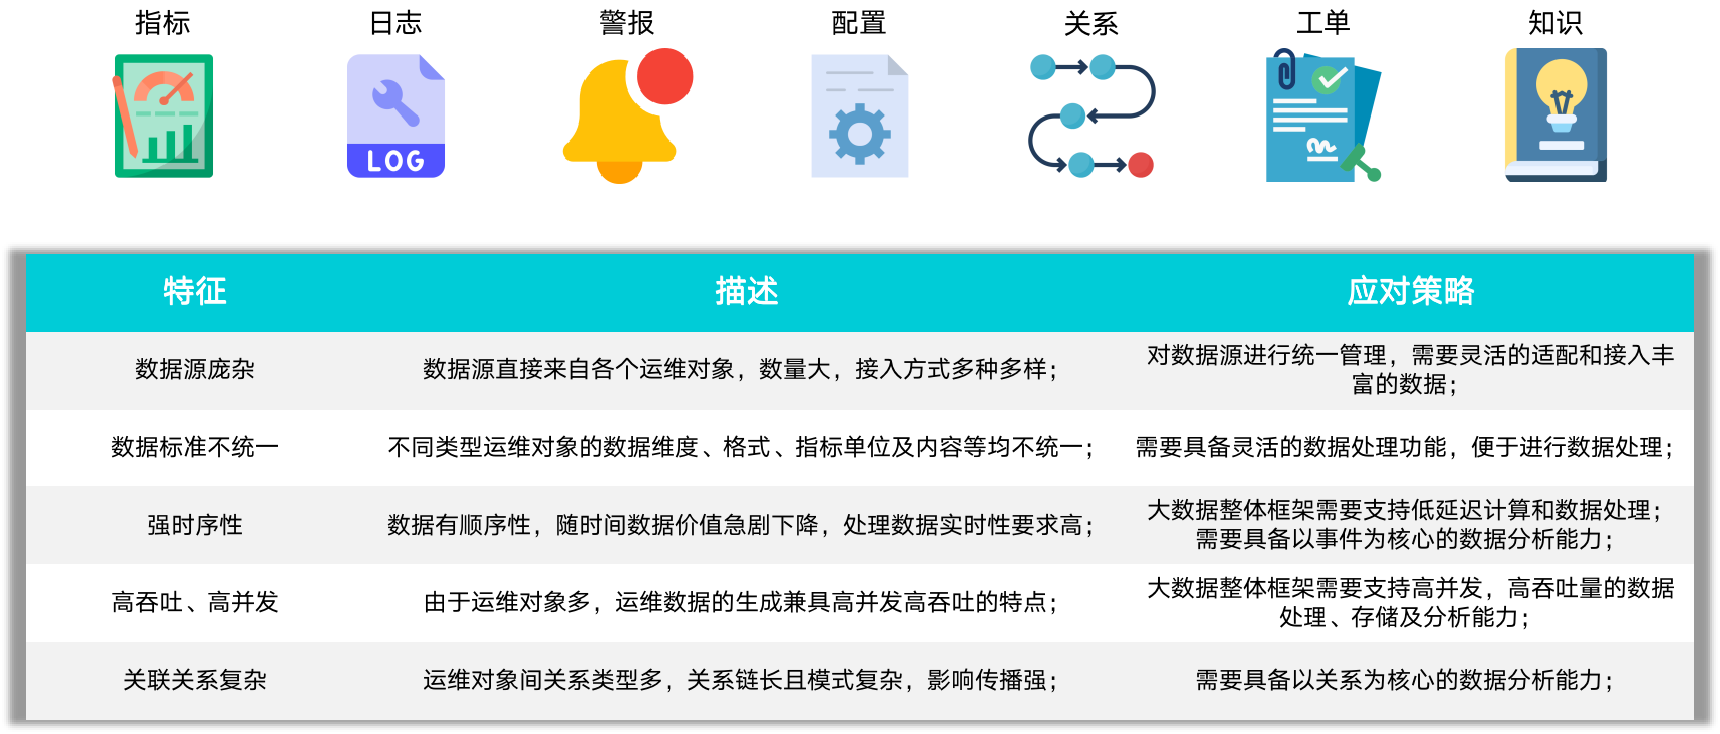
Analysis and interpretation of the current situation and challenges faced by enterprise operation and maintenance in the digital era

【sv】 assign force区别

Spark 3. Source code analysis of wscg mechanism based on X

下一代web服务器Caddy —— 筑梦之路
MySql5.7.26安装

What common problems will you encounter when entering the field of robot UAV?

斜率优化DP
OneFlow学习笔记:从Functor到OpExprInterpreter
随机推荐
【数据挖掘】用Excel挖掘股权关系并按照年份统计不同类型的亲缘关系在上市公司中的分布和趋势【可视化呈现】
Use of navigationview
110T oracle故障恢复
【SQL server速成之路】数据库的查询
Error found while starting libgocrypto.mondb so. ten
Slim 2022 Outlook: cram istio's complexity into the smart black box
Addition, deletion, modification and query of advanced MySQL data (DML)
Point cloud registration (I) - ICP method
启动mongodb时发现错误libcrypto.so.10
在互联网+的背景下,企业如何创新客户服务?
About the problem that the picture library of tpshop open source mall version 6.0 does not display pictures
dnspy 修改 伊格利亚战记 军队维护费和英雄维护系数
Directory of message queuing Master Course
async 函数
Use bitnami PostgreSQL docker image to quickly set up stream replication clusters
Daily CISSP certification common mistakes (April 21, 2022)
Best practices for cost reduction and efficiency increase of public cloud
Robot system design coppeliasim simulation
MySql5. 7.26 installation
How does the project solve cross domain problems