当前位置:网站首页>Mathematical modeling preparation knowledge
Mathematical modeling preparation knowledge
2022-08-10 23:28:00 【 Childhood】
The competition time is generally every year9月,提交的材料MD5生成之后,don't touch it again,不要打开.
Watch video advice:
- 学习算法的过程,As long as you understand the advantages and disadvantages of the algorithm,适用范围,Knowing exactly what each algorithm can do,以及如何实现.
- See a good paper,了解解题思路,See a problem, can think in that way
1 Baidu Skills
- 加双引号”“,进行完全匹配
- 标题Required keywords:add before queryintitle
- 搜索文档:after query word 空格 再输入filetype:文件格式(doc/pdf/xls等等)
- 去掉不想要的:Add a space after the query word followed by a minus sign and a keyword
例如:线性规划 filetype:pdf -百度文库
2 How to Query Skills
先看HowNet's master thesis,按照”被引“排序,see background introduction,Take advantage of advanced search.
For the digital and analog national competition,No need to look up foreign literature
3 go there to find data
- Priority on HowNet、Search on Google Scholar and other platforms
- 国家统计局:最全面,Monthly Quarterly Annual,Every region, every sector, every industry
国家数据 (stats.gov.cn) https://data.stats.gov.cn/
- EPSDATA平台:Have a wealth of data processed data resources and a large number of analysis results,是收费的,But you can apply for7天的试用 EPSDATA官网 (epsnet.com.cn)
 https://www.epsnet.com.cn/index.html#/Index
3.1 数据预处理
缺失值
- Data provided by the competition,found that some cells wereNULL或空的
- 缺失太多,For example, survey demographic information,发现”年龄“This item is missing40%.just delete the indicator
- 最简单的处理:take the mean instead of,Mode imputation
- Newton插值法
- According to a fixed formula,Construct an approximate function,补上缺失值,Universal applicability
- 缺点:Unstable oscillations at the edge of the range,The runge phenomenon,Do not use to tutor the title of the request.
- Applicable questions:热力学温度、地形测量、Positioning, etc. only pursue the accuracy of the function value and do not care about the changed data
- 样条插值法
- Interpolate with piecewise smooth curves,Smooth means that the curve is not only continuous,Must have the continuous curvature
- Applicable questions:零件加工,Reservoir water flow,图像”基线漂移“,High precision requirements such as robot trajectory、No mutation of data
异常值
- Data that is significantly different from other numerical values in the sample,For example, one of the elevated data for a group of people has3米2的
- 正态分布3σ原则
- 求解步骤:1.计算均值u和标准差σ;2.Determine whether each data value is in(u-3σ,u+3σ)内,Absence is an outlier.
- 适用题目:The general accord with normal distribution,such as population data、测量误差、Production and processing quality、考试成绩
- topic not used:Meet other distribution as a whole,For example, people queuing at a bus stop,符合泊松分布
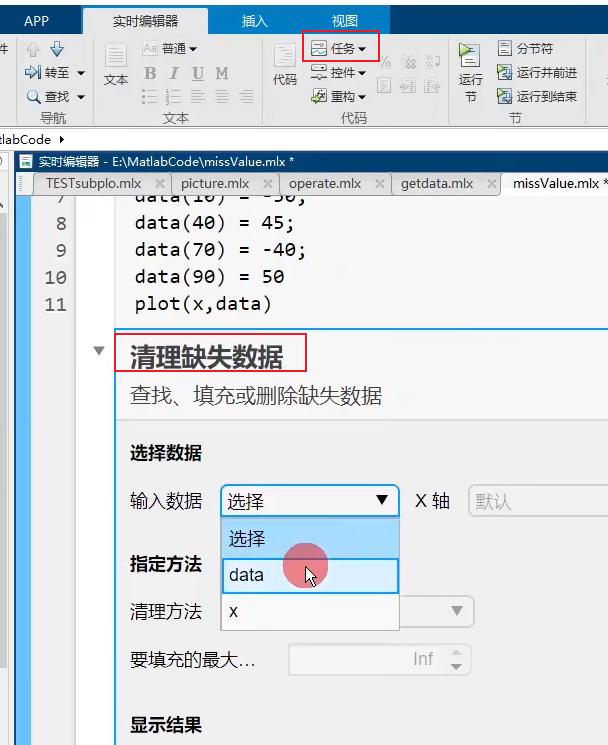
MATLAB异常值处理方法:
创建****.mlx live code file,This option is only available in higher versions
4 建模全过程
- A complete digital and analog paper
- 包括摘要(最重要),问题重述、模型假设和符号说明、模型建立与求解(内容最多)、模型的优缺点与改进方法、References and Appendices.
- 摘要:论文研究的问题、用了什么方法、what result did,and the approximate steps for each part.
- 问题重述
- 将题目简述一遍即可,并不重要.注意不要复制粘贴,避免查重.
- 模型假设和符号说明
- Good assumptions can do more with less
- 符号说明:Defined in the paper have important symbol list form.
model has to be built:
- 一组公式,Explanation for each variable in the formula,就是一个模型
- 先查阅资料,看着资料,Paraphrase a simple model in your own words,再根据题目中的约束条件去一步步修改模型,Substitute the variables in the question into the model.
- 模型求解
- Not every question on the subject needs to have a model
- 模型的优缺点与改进方法:这一部分不是必须的,可以简单分析下前文模型的优缺点,Disdain if there is no way to improve
- 结合查到的文献,In the analysis text, the model is often used in the kind of problem,又与本文所求解的问题有何区别
附录:The code used when solving in the text,Pay attention to changing the variable names in the found code,avoid being checked
5 论文排版注意事项
Headings and text at all levels are clearly structured,Don't have large blanks,No more than the general title level3级,The text in the text is in Song type,英文Times New Roman,表格采用Standard three-line meter.
6 标题怎么写
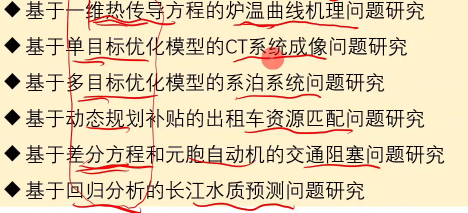
读完标题,You can know what model is built in this article.简明扼要、符合规范、便于检索,Try to use words that everyone knows.
基于***模型/算法的***问题研究
- ***The model is the core model in the text
- ***The problem is the central word of the competition question
- Don't use too many modifiers
7 How to write an abstract
Ask the reviewer to read the abstract after,know this article解决的问题、建立的模型和求解结果.控制在3/4~1页.字数800~1100.
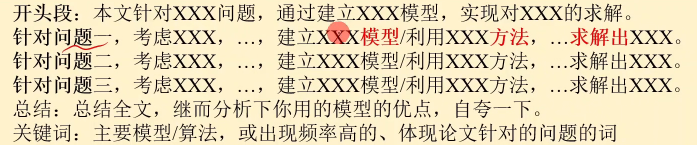
opening paragraph template:本文主要研究了***问题.根据***,利用***模型/方法,求解出****.
- 第一句:State the research question
- 第二句:Explain the model used in the full text/算法、采取的操作
- Do not write detailed solution results in the opening paragraph.
middle section template:针对问题一,考虑/根据***,...,建立***模型/利用****方法,....求解出****.Be sure to write clearly.
- 优化类、Prediction and Physics topics,To explicitly write the value.
- Questions Asking for Advice or Evaluation,Clearly write down the conclusions and data basis,but no form,Excessive data can illustrate data see appendix.
总结段:If the abstract exceeds one page after writing,可以不写,Don't repeat what was written before,Write some features of this article、Boast of statements.
关键词:一般为4~6个,Models and Algorithms Used,Professional name that everyone knows,question key word,中间以空格分开
8 参考文献
Citing literature or public informationmust be specifiedList references andMark the corresponding text in the text.
9 作图技巧
注意排版,无首行缩进,居中对齐.
Common drawing software:AxGlyph、MATLAB,万能神器EChartsApache EChartshttps://echarts.apache.org/zh/index.html
10 Use page breaks smartly
Abstract on its own page,Insert a page break after the abstract.Note the difference between page breaks and section breaks,Section breaks are generally not used,Mainly use page breaks.
11 MATLAB如何导入数据
第一中方法:利用CTRLkey to select the data to be imported.export as table
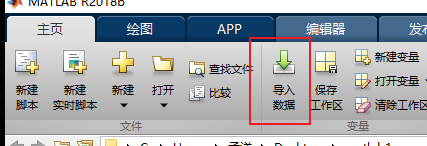
第二种方法:
horse_data = xlsread('E:\文件位置\new_data.xlsx','sheet1');  % 导入表格数据
horse_1 = horse_data(1,:);   % Import the first row of data
12 线性规划
线性规划:All variables are square.
Applicable questions:
- 题目中提到 如何分配/安排 尽量多(少) 最多(少) 利润最大 最合理 等词.
- 生产安排:原材料、Device is limited,总利润最大
- 投资收益:资产配置、收益率、损失率、组合投资、总收益最大
- sales shipping:产地、销地、产量、销量、运费、The lowest total shipping cost
- 车辆安排:路线、起点终点、承载量、时间点、The most reasonable arrangement of trains
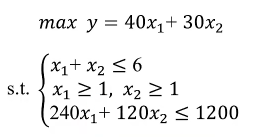
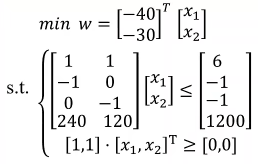
有限的条件下,最大的收益,s.t.表示约束条件,设置的参数x1 x2 decision variable,max为目标函数
MATLAB实现:Linprog函数
- model asmatlab标准型:目标函数最小值、约束条件<=或=
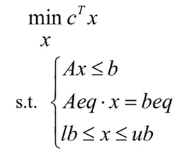
- [x, fval] = linprog(c, A, b, Aeq, beq, lb, ub)
c of the objective function coefficients列向量 a, b 不等式约束条件The variable coefficient matrix and the parameter term matrix of aeq, beq 等式约束条件The coefficient matrix and constant term matrix of lb, ub 决策变量The minimum and maximum values of
x Returns the value of the variable for the optimal solution
fval 返回目标函数的最优值
- 若不存在不等式约束,用 [] 代替A和b [x, fval] = linprog(c, [], [], Aeq, beq, lb, ub)
- 若不存在等式约束,用 [] 代替Aeq, beq [x, fval] = linprog(c, A, b,[], [], lb, ub)
- No equality constraints and minimum、When the maximum value is constrained,可以不写Aeq, beq, lb, ub [x, fval] = linprog(c, A, b)
- If the question finds the maximum value:The objective function is to add a negative sign at both ends of the equal sign to find the minimum value,After solving, the target value is negative again.
c = [-40; -30]; % Note that it is written as a column vector
a = [1 1; -1 0; 0 -1; 240 120];
b = [6; -1; -1; 1200];
% because of the constraintsa中,已经写了x1   x2  的范围,So there is no need to writelb,ub了
[x, y] = linprog(c, a, b);
y = -y;![]()
13 非线性规划
有限的条件下,求最大的收益
非线性规划:At least one variable is not a power,Involves the trigonometric functions
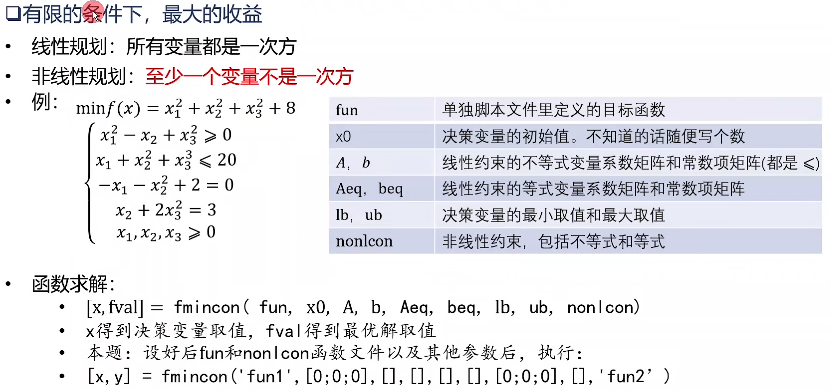
suitable for competition:such as angle adjustment,Flight management to avoid collisions,The best viewing angle in the cinema.
14 多目标规划问题
既要****,又要*****
- 例如,目标1是“不超过”,That is, as much as possible≤;目标2是 充分利用,That is, as much as possible = ,目标3is not less than,也就是≥
- 需要衡量每个目标的完成情况,And the importance of subjective to distinguish the three objectives,使得整体的完成情况尽量好.
- 绝对约束:Constraints built into the model,必须满足,Otherwise it is infeasible
- 目标约束:Model of inequality in the right end the pursuit of the value of the deviation is allowed
- 优先因子:The importance of setting goals
求解方法:搜索MATLAB的fgoalattain函数,Or sequential algorithm,或用Lingo求解
15 最短路径问题
最短路径:从图Depart from some point in,In order to have another vertexThe sum of the weights of the passing edges is the smallest的一条路径.
图:Structure of Edges and Nodes,分为有向图和无向图
权重:道路的长度
MATLAB求解最短路径:Dijkstra算法,或MATLAB的graphshortestpath函数
第一步:生成邻接矩阵
W = [10,5,2,1,4,6,7,3,9,2];    % 每条边的权值

%     sparse生成稀疏矩阵,That is, except for a few elements noted,其余都是0
%    sparseThe value of the element in the same position of the first and second matrices is  从*到*的方向,对应Wweight in
DG = sparse([],[],W)    % DGThe adjacency matrix generated for
第二步,Generate graph objects,求解最短路径
%    distis the value of the shortest path,pathis the node order of the shortest path
%    predis the endpoint of the shortest path to each node before the previous node,一般用不到
%    1 代表起始节点,3 代表目标节点,即1到3的最短路径
[dist,path,pred] = graphshortestpath(DG,1,3);

%    biographGenerate graph objects,view显示该图
point_name = ["节点1","节点2","节点3","节点4"];
h = view(biograph(DG,point_name,'ShowWeights','on'))   % The last two parameters are the length of the display path
% Mark the nodes and edges of the shortest path in red and increase the line width
% getedgesbynodeid得到图hthe handle of the specified edge
% The first parameter is the image,The second is the out point of the edge,The third is edge into the point
% The handle ensures that the corresponding thing can be found
% getQuery graph properties,h.Nodes(path),'ID'得到图hedge of shortest path in
% set设置图形属性
edges = getedgesbyodeid(h,get(h.Nodes(path),'ID'));
set(edges,'LineColor',[1 0 0]); % R G B
set(edges,'LineWidth',2);注:Node labels and font size can also be modified,通过getedgesbyodeid函数获取相关信息,再进行set
16 最小生成树
Connect all vertices with minimum total path.
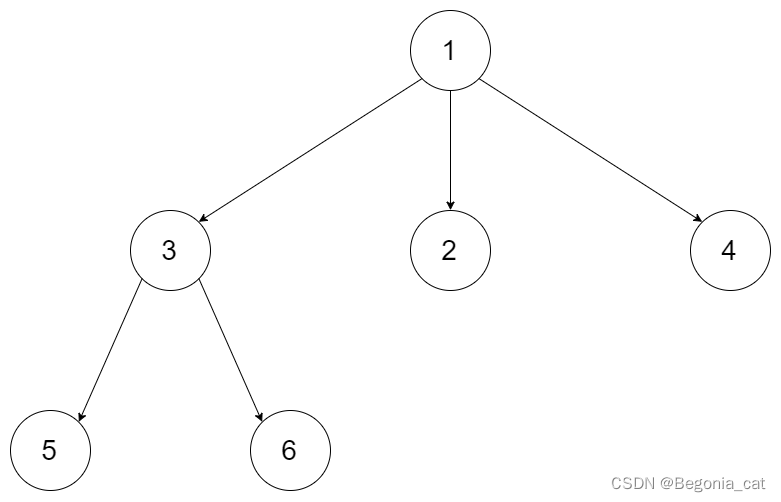
例:build connectivity7railway network of cities,The routes that can be constructed and the corresponding cost are shown in the figure,How to build to minimize total cost.
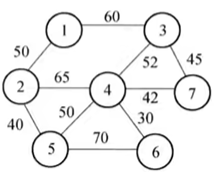
问题分析:
- 连通7个城市:generated graph,start from any vertex,All other vertices must be reachable along the edge,这种图叫做连通图.
- The course can be built and the corresponding cost:图的边,及其权值
- The total cost at least:The sum of the weights is the least
- difference from shortest path:The shortest path is for a vertex as the starting point,Minimum spanning tree is where all vertices are connected and the total path is the smallest.
%    The first two matrix corresponding to the node,Avoid repetition when writing mostly undirected graphs,技巧第2matrices write nodes larger than the first matrix
s = [1 1 2 2 3 3 4 4 4 5];
t = [2 3 4 5 4 7 5 6 7 6];
wights = [50,60,65,40,52,45,50,30,42,70];
%     生成无向图,wights是对应的权值
G = graph(s,t,weights);
%    求出最小生成树,得到的TContains the weights of nodes and corresponding edges of the minimum spanning tree
T = minspantree(G);

% p = plot(G)Can show the pictures,The back is to set the font for aesthetics
p = plot(G,'EdgeLabel',G.Edges.Weight,'MarkerSize',8,'NodeFontSize',16,'EdgeFont',4)
%    Highlight nodes and edges in the drawn graph
highlight(p,T,'EdgeColor','red','LineWidth',3)
Solving the Minimum Spanning Tree
1.利用MATLAB的minspantreefunction to solve minimum spanning tree,see above procedure
2.Kruskal算法:适合点多边少的图
3.Prim算法:Suitable for graphs with more edges and less edges
17 灰色预测GM(1,1)模型
GM(1,1)模型:1阶微分方程,1个变量
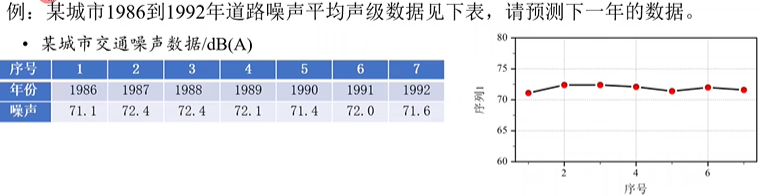
特点:数据少,no obvious pattern,Suitable for using grey prediction
看不出规律,Using the cumulative method to create rules.
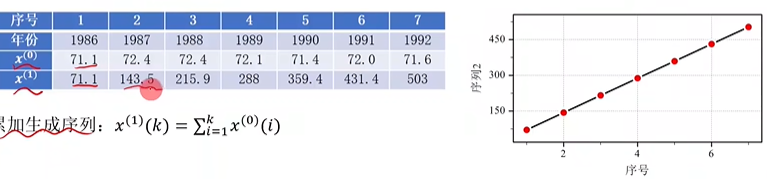
new sequence generated,Generally looks like an exponential curve(直线)
- 可以用Expression of an exponential curve or even a straight line式来逼近This new order
- 构建一阶常微分方程来求解拟合曲线的函数表达式
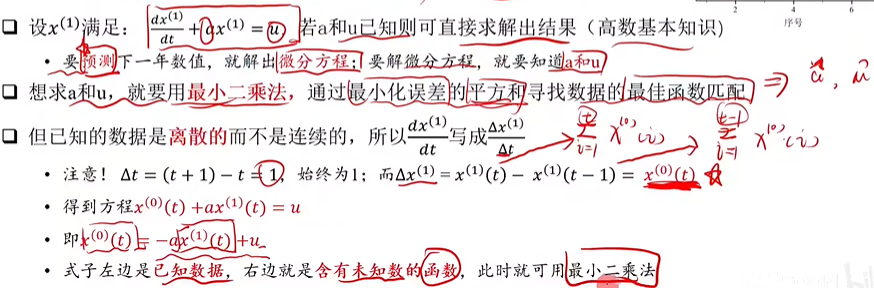
优点:Available when there is little data and no obvious pattern,Using Differential Equations to Mining the Essential Laws of Data
缺点:Grey forecasts are only suitable for short-term forecasts、Exponential Growth Forecast
边栏推荐
猜你喜欢


随机推荐
HGAME 2022 Week2 writeup
消息队列总结
【软件测试】2022年最火的十大测试工具,你掌握了几个
Ndk 和Cmake报错解决
PyTorch官方文档学习笔记(备忘)
打开老项目项目的报错(以高德地图demo为例)
CW614N铜棒CuZn39Pb3对应牌号
API服务网关
十年架构五年生活-08 第一次背锅
正交基(线性代数)
C3604环保黄铜带
服务器上行带宽和下行带宽指的是什么
sklearn.datasets.make_circles
HGAME 2022 Final Pokemon v2 writeup
C194铜合金C19400铁铜合金
还在用 Xshell?你 out 了,推荐一个更现代的终端连接工具,好用到爆!
企业小程序怎么开发自己的小程序?
Metasploit——客户端渗透
CW617N锡青铜 CuZn40Pb2对应牌号
李宏毅机器学习-- Backpropagation