当前位置:网站首页>信号生成和可视化
信号生成和可视化
2022-08-08 16:39:00 【jk_101】
目录
此示例说明如何使用 Signal Processing Toolbox 中提供的函数生成广泛使用的周期和非周期性波形、扫频正弦波和脉冲序列。
周期性波形
除了 MATLAB 中的 sin 和 cos 函数外,Signal Processing Toolbox 还提供其他函数(如 sawtooth 和 square)来生成周期性信号。
sawtooth 函数生成锯齿波,波峰在 ±1,周期为 2π。可选宽度参数以 2π 的小数倍来指定信号最大值出现的位置。
square 函数生成周期为 2π 的方波。可选参数指定占空比,即信号为正的周期的百分比。
以 10 kHz 的采样率生成 1.5 秒的 50 Hz 锯齿波。对一个方波进行重复计算。
fs = 10000;
t = 0:1/fs:1.5;
x1 = sawtooth(2*pi*50*t);
x2 = square(2*pi*50*t);

subplot(2,1,1)
plot(t,x1)
axis([0 0.2 -1.2 1.2])
xlabel('Time (sec)')
ylabel('Amplitude')
title('Sawtooth Periodic Wave')

subplot(2,1,2)
plot(t,x2)
axis([0 0.2 -1.2 1.2])
xlabel('Time (sec)')
ylabel('Amplitude')
title('Square Periodic Wave')
如图所示:

非周期性波形
为了生成三角形、矩形和高斯脉冲,工具箱提供了tripuls、rectpuls 和 gauspuls 函数。
tripuls 函数生成以 t = 0 为中心、默认宽度为 1 的采样非周期性单位高度三角形脉冲。
rectpuls 函数生成以 t = 0 为中心、默认宽度为 1 的采样非周期性单位高度矩形脉冲。非零幅值的区间定义为在右侧开放:rectpuls(-0.5) = 1,而 rectpuls(0.5) = 0。
生成 2 秒的三角形脉冲,采样率为 10 kHz,宽度为 20 ms。对一个矩形脉冲进行重复计算。
fs = 10000;
t = -1:1/fs:1;
x1 = tripuls(t,20e-3);
x2 = rectpuls(t,20e-3);

figure
subplot(2,1,1)
plot(t,x1)
axis([-0.1 0.1 -0.2 1.2])
xlabel('Time (sec)')
ylabel('Amplitude')
title('Triangular Aperiodic Pulse')

subplot(2,1,2)
plot(t,x2)
axis([-0.1 0.1 -0.2 1.2])
xlabel('Time (sec)')
ylabel('Amplitude')
title('Rectangular Aperiodic Pulse')
如图所示:

gauspuls 函数使用指定时间、中心频率和小数带宽生成高斯调制正弦脉冲。
sinc 函数计算输入向量或矩阵的数学正弦函数。正弦函数是宽度为 2π,高度为单位高度的矩形脉冲的连续傅里叶逆变换。
生成带宽为 60%、采样率为 1 MHz 的 50 kHz 高斯 RF 脉冲。当包络比峰值低 40 dB 时,截断脉冲。
tc = gauspuls('cutoff',50e3,0.6,[],-40);
t1 = -tc : 1e-6 : tc;
y1 = gauspuls(t1,50e3,0.6);
为一个线性间距向量生成正弦函数:
t2 = linspace(-5,5);
y2 = sinc(t2);

figure
subplot(2,1,1)
plot(t1*1e3,y1)
xlabel('Time (ms)')
ylabel('Amplitude')
title('Gaussian Pulse')

subplot(2,1,2)
plot(t2,y2)
xlabel('Time (sec)')
ylabel('Amplitude')
title('Sinc Function')
如图所示:

扫频波形
工具箱还提供生成扫频波形的函数,如 chirp 函数。两个可选参数以度为单位指定替代扫描方法和初始相位。下面是使用 chirp 函数生成线性或二次、凸和凹二次 chirp 的几个示例。
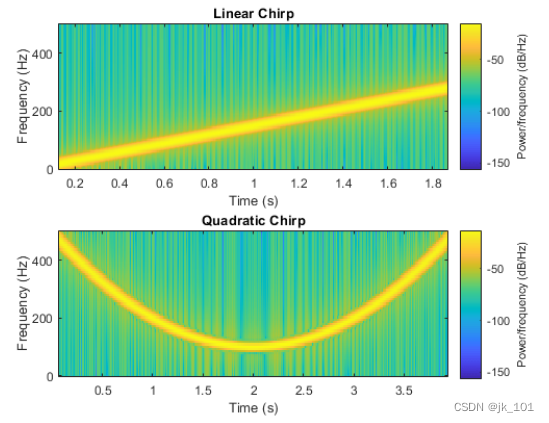
生成线性 chirp。
t = 0:0.001:2;                 % 2 secs @ 1kHz sample rate
ylin = chirp(t,0,1,150);       % Start @ DC, cross 150Hz at t=1sec
生成二次 chirp。
t = -2:0.001:2;                % +/-2 secs @ 1kHz sample rate
yq = chirp(t,100,1,200,'q');   % Start @ 100Hz, cross 200Hz at t=1sec
计算并显示 chirp 的频谱图。
figure
subplot(2,1,1)
spectrogram(ylin,256,250,256,1E3,'yaxis')
title('Linear Chirp')

subplot(2,1,2)
spectrogram(yq,128,120,128,1E3,'yaxis')
title('Quadratic Chirp')
如图所示:
生成凸二次 chirp。
t = -1:0.001:1;          % +/-1 second @ 1kHz sample rate
fo = 100;
f1 = 400;                % Start at 100Hz, go up to 400Hz
ycx = chirp(t,fo,1,f1,'q',[],'convex');
生成凹二次 chirp。
t = -1:0.001:1;          % +/-1 second @ 1kHz sample rate
fo = 400;
f1 = 100;                % Start at 400Hz, go down to 100Hz
ycv = chirp(t,fo,1,f1,'q',[],'concave');
计算并显示 chirp 的频谱图。
figure
subplot(2,1,1)
spectrogram(ycx,256,255,128,1000,'yaxis')
title('Convex Chirp')

subplot(2,1,2)
spectrogram(ycv,256,255,128,1000,'yaxis')
title('Concave Chirp')
如图所示:

另一个函数生成器是 vco(压控振荡器),它生成以输入向量确定的频率振荡的信号。输入向量可以是三角形、矩形或正弦波等。
生成以 10 kHz 采样的 2 秒信号,其瞬时频率为三角形。对一个矩形进行重复计算。
fs = 10000;
t = 0:1/fs:2;
x1 = vco(sawtooth(2*pi*t,0.75),[0.1 0.4]*fs,fs);
x2 = vco(square(2*pi*t),[0.1 0.4]*fs,fs);
绘制生成的信号的频谱图。
figure
subplot(2,1,1)
spectrogram(x1,kaiser(256,5),220,512,fs,'yaxis')
title('VCO Triangle')

subplot(2,1,2)
spectrogram(x2,256,255,256,fs,'yaxis')
title('VCO Rectangle')
如图所示:

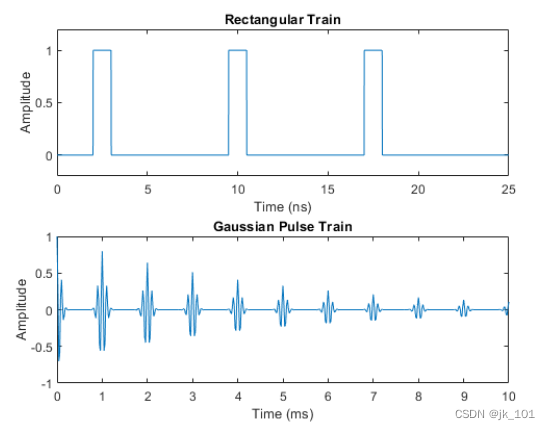
脉冲序列
要生成脉冲序列,可以使用 pulstran 函数。
构造一个 2 GHz 矩形脉冲序列,它以 7.5 ns 的间距和 100 GHz 的速率采样。
fs = 100E9;                    % sample freq
D = [2.5 10 17.5]' * 1e-9;     % pulse delay times
t = 0 : 1/fs : 2500/fs;        % signal evaluation time
w = 1e-9;                      % width of each pulse
yp = pulstran(t,D,@rectpuls,w);
生成 10 kHz、50% 带宽的周期性高斯脉冲信号。脉冲重复频率为 1 kHz,采样率为 50 kHz,脉冲序列长度为 10 毫秒。重复幅值每次应按 0.8 衰减。使用函数句柄指定生成器函数。
T = 0 : 1/50e3 : 10e-3;
D = [0 : 1/1e3 : 10e-3 ; 0.8.^(0:10)]';
Y = pulstran(T,D,@gauspuls,10E3,.5);

figure
subplot(2,1,1)
plot(t*1e9,yp);
axis([0 25 -0.2 1.2])
xlabel('Time (ns)')
ylabel('Amplitude')
title('Rectangular Train')

subplot(2,1,2)
plot(T*1e3,Y)
xlabel('Time (ms)')
ylabel('Amplitude')
title('Gaussian Pulse Train')
如图所示:
边栏推荐
猜你喜欢


随机推荐
MySQL中常见的内些...啥
急了,Mysql索引中最不容易记的三个知识点通透了
R语言4.04安装教程
leetcode 155. Min Stack最小栈(中等)
MVCC,主要是为了做什么?
【数学模型】灰色关联分析
产品经理常用的19类50+工具软件盘点
【论文阅读】RAL 2022: Receding Moving Object Segmentation in 3D LiDAR Data Using Sparse 4D Convolutions
Mysql都有那些最需要掌握的原理?
项目管理流程包含哪些
小米产品使用体验,问题分析及建议
Web3构架是怎么样的?
Is it safe to open an account with CICC Wealth?How does it work?
bzoj5063 旅游
使用 FasterTransformer 和 Triton 推理服务器加速大型 Transformer 模型的推理
Grid 布局介绍
使用 PyGame 的冒泡排序可视化工具
Charles MOCK 数据 htpps代理
中金财富开户安全吗?怎么操作?
【云原生】云原生相关技术概念总结