当前位置:网站首页>try catch 对性能影响
try catch 对性能影响
2022-08-09 09:26:00 【心中要有一片海】
引言
之前一直没有去研究try catch的内部机制,只是一直停留在了感觉上,正好这周五开会交流学习的时候,有人提出了相关的问题。借着周末,正好研究一番。
讨论的问题
当时讨论的是这样的问题:
比较下面两种try catch写法,哪一种性能更好。
        for (int i = 0; i < 1000000; i++) { try { Math.sin(j); } catch (Exception e) { e.printStackTrace(); }
        }
try {
for (int i = 0; i < 1000000; i++) {
Math.sin(j);
}
} catch (Exception e) {
e.printStackTrace();
}结论
在没有发生异常时,两者性能上没有差异。如果发生异常,两者的处理逻辑不一样,已经不具有比较的意义了。
分析
要知道这两者的区别,最好的办法就是查看编译后生成的Java字节码。看一下try catch到底做了什么。
下面是我的测试代码
package com.kevin.java.performancetTest;
import org.openjdk.jmh.annotations.Benchmark;
/** * Created by kevin on 16-7-10. */
public class ForTryAndTryFor {
public static void main(String[] args) {
tryFor();
forTry();
}
public static void tryFor() {
int j = 3;
try {
for (int i = 0; i < 1000; i++) {
Math.sin(j);
}
} catch (Exception e) {
e.printStackTrace();
}
}
public static void forTry() {
int j = 3;
for (int i = 0; i < 1000; i++) {
try {
Math.sin(j);
} catch (Exception e) {
e.printStackTrace();
}
}
}
}使用javap -c fileName.class输出对应的字节码
$ javap -c ForTryAndTryFor.class
Compiled from "ForTryAndTryFor.java"
public class com.kevin.java.performancetTest.ForTryAndTryFor {
public com.kevin.java.performancetTest.ForTryAndTryFor();
Code:
0: aload_0
1: invokespecial #1 // Method java/lang/Object."<init>":()V
4: return
public static void main(java.lang.String[]);
Code:
0: invokestatic #2 // Method tryFor:()V
3: invokestatic #3 // Method forTry:()V
6: return
public static void tryFor();
Code:
0: iconst_3
1: istore_0
2: iconst_0
3: istore_1
4: iload_1
5: sipush 1000
8: if_icmpge 23
11: iload_0
12: i2d
13: invokestatic #4 // Method java/lang/Math.sin:(D)D
16: pop2
17: iinc 1, 1
20: goto 4
23: goto 31
26: astore_1
27: aload_1
28: invokevirtual #6 // Method java/lang/Exception.printStackTrace:()V
31: return
Exception table:
from to target type
2 23 26 Class java/lang/Exception
public static void forTry();
Code:
0: iconst_3
1: istore_0
2: iconst_0
3: istore_1
4: iload_1
5: sipush 1000
8: if_icmpge 31
11: iload_0
12: i2d
13: invokestatic #4 // Method java/lang/Math.sin:(D)D
16: pop2
17: goto 25
20: astore_2
21: aload_2
22: invokevirtual #6 // Method java/lang/Exception.printStackTrace:()V
25: iinc 1, 1
28: goto 4
31: return
Exception table:
from to target type
11 17 20 Class java/lang/Exception
}指令含义不是本文的重点,所以这里就不介绍具体的含义,感兴趣可以到Oracle官网查看相应指令的含义The Java Virtual Machine Instruction Set
好了让我们来关注一下try catch 到底做了什么。我们就拿forTry方法来说吧,从输出看,字节码分两部分,code(指令)和exception table(异常表)两部分。当将java源码编译成相应的字节码的时候,如果方法内有try catch异常处理,就会产生与该方法相关联的异常表,也就是Exception table:部分。异常表记录的是try 起点和终点,catch方法体所在的位置,以及声明捕获的异常种类。通过这些信息,当程序出现异常时,java虚拟机就会查找方法对应的异常表,如果发现有声明的异常与抛出的异常类型匹配就会跳转到catch处执行相应的逻辑,如果没有匹配成功,就会回到上层调用方法中继续查找,如此反复,一直到异常被处理为止,或者停止进程。(具体介绍可以看这篇文章How the Java virtual machine handles exceptions。)所以,try 在反映到字节码上的就是产生一张异常表,只有发生异常时才会被使用。由此得到出开始的结论。
这里再对结论扩充:
try catch与未使用try catch代码区别在于,前者阻止Java对try块的代码的一些优化,例如重排序。try catch里面的代码是不会被编译器优化重排的。对于上面两个函数而言,只是异常表中try起点和终点位置不一样。至于刚刚说到的指令重排的问题,由于for循环条件部分符合happens- before原则,因此两者的for循环都不会发生重排。当然只是针对这里而言,在实际编程中,还是提倡try代码块的范围尽量小,这样才可以充分发挥Java对代码的优化能力。
测试验证
既然通过字节码已经分析出来了,两者性能没有差异。那我们就来检测一下吧,看看到底是不是如前面分析的那样。
在正式开始测试时,首先我们要明白,一个正确的测试方法,就是保证我们的测试能产生不被其他因素所歪曲污染的有效结果。那应该使用什么方法来测试我们的代码呢?
不正确的测试
这里首先说一下一种常见的错误的测量方法,测量一个方法的执行时间,最容易想到的应该是下面这种了:
long startTime = System.currentTimeMillis();
doReallyLongThing();
long endTime = System.currentTimeMillis();
System.out.println("That took " + (endTime - startTime) + " milliseconds");但是我会跟你说,这个方式十分的不准确,我这里给大家展示一下我的使用上面的方式来进行测试的结果
package com.kevin.java.performancetTest;
/** * Created by kevin on 16-7-10. */
public class ForTryAndTryFor {
public static void main(String[] args) {
forTry();
tryFor();
}
public static void tryFor() {
long startTime = System.currentTimeMillis();
int j = 3;
        try {
            for (int i = 0; i < 1000000; i++) {
                Math.sin(j);
            }
        } catch (Exception e) {
            e.printStackTrace();
        }
long endTime = System.currentTimeMillis();
System.out.println("tryFor " + (endTime - startTime) + " milliseconds");
}
public static void forTry() {
long startTime = System.currentTimeMillis();
int j = 3;
for (int i = 0; i < 1000000; i++) {
try {
Math.sin(j);
} catch (Exception e) {
e.printStackTrace();
}
}
long endTime = System.currentTimeMillis();
System.out.println("forTry " + (endTime - startTime) + " milliseconds");
}
}测试结果 
看到这个你是不是会认为tryFor比forTry快了呢?当然一般而言,不会这么快就下定论,所以接着你就会继续运行数次,然后可能还是会看见类似上面的结果。很有可能你就会确信forTry比tryFor快。但是这个测试的结果是不准确的,确切的说是无效的。
为什么呢?如果你测试的次数足够多(其实也不用很多,我这里就运行了十几次这样),你就会发现问题。我再列出这十几次测试中比较有代表性的测试结果的截图。
图1 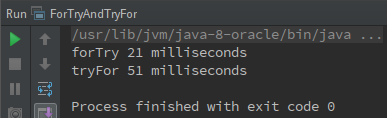
图2 
图3 
从上面结果看来,绝大多数时候,tryFor比forTry快。那是不是可以说tryFor比forTry快了呢?如果没有前面分析,如果你只是测试了几次,并且结果都类似的时候,你是不是会就因此下定论了呢?
上面问题就出现在这个绝大多数,当你运行的次数越多,就越发的体会到结果的扑朔迷离。
至少有下面两点给人扑朔迷离的感觉:
- 每次的执行时间都相差很大。
同一个函数会出现,两次执行结果可能相差好几倍的情况。比如图1中的forTry竟然比图2的forTry快了近6倍。 - 偶尔forTry会比tryFor快(我上面的截取的是比较有代表性的结果,实际运行的时候绝大多数情况显示的是tryFor快)
那是什么导致了结果如此的扑朔迷离?原因至少有下面这些
- System.currentTimeMillis()测量的只是逝去的时间,并没有反映出cpu执行该函数真正消耗的时间。
这导致线程未被分配cpu资源时,等待cpu的时间也会被计算进去 JIT优化导致结果出现偏差。
像这种多次循环非常容易触发JIT的优化机制,关于JIT,这里简短的介绍一下在Java编程语言和环境中,即时编译器(JIT compiler,just-in-time compiler)是一个把Java的字节码(包括需要被解释的指令的程序)转换成可以直接发送给处理器的指令的程序。当你写好一个Java程序后,源语言的语句将由Java编译器编译成字节码,而不是编译成与某个特定的处理器硬件平台对应的指令代码(比如,Intel的Pentium微处理器或IBM的System/390处理器)。字节码是可以发送给任何平台并且能在那个平台上运行的独立于平台的代码。
JIT 编译器概述
Just-In-Time (JIT) 编译器是 Java Runtime Environment 的一个组件,用于提高运行时的 Java
应用程序的性能。Java 程序由多个类组成,它包含可在许多不同计算机体系结构上由 JVM 解释的与平台无关的字节码。在运行时,JVM 装入类文件,确定每个单独的字节码的语义,并执行相应的计算。解释期间额外使用处理器和内存意味着 Java应用程序的执行速度要慢于本机应用程序。JIT 编译器通过在运行时将字节码编译为本机代码以帮助提高 Java 程序的性能。
JIT 编译器在缺省情况下为已启用,并在调用 Java 方法时被激活。JIT 编译器将该方法的字节码编译为本机机器码,“即时”编译该代码以便运行。在编译方法时,JVM 直接调用该方法的已编译代码,而不是对代码进行解释。理论上,如果编译不需要占用处理器时间和内存,那么编译每个方法都可能使 Java程序速度接近于本机应用程序的速度。
JIT 编译需要占用处理器时间和内存。在 JVM首次启动时,将调用数千种方法。即使程序最终实现了较高的峰值性能,编译所有这些方法也会对启动时间产生显著影响。
实际上,第一次调用方法时不会对方法进行编译。 对于每个方法,JVM 都会保留一个调用计数,每次调用方法时该计数都将递增。JVM对方法进行解释,直至其调用计数超过 JIT 编译阈值。因此,在 JVM启动后将立即编译常用方法,而在较长时间之后(或者根本不编译)不常使用的方法。JIT 编译阈值帮助 JVM 快速启动并且还可提高性能。 谨慎选择阈值,以在启动时与长期性能之间实现最佳平衡。
在编译方法后,调用计数将重置为 0,并且对该方法的后续调用将继续使其计数递增。在方法的调用计数到达 JIT 重新编译阈值时,JIT 编译器将执行第二次编译,与前一次编译相比,其优化选择更多。此过程将重复,直至到达最大优化级别。Java程序的最忙碌方法始终是最积极地进行优化,从而实现使用 JIT 编译器的性能优势最大化。JIT编译器还可在运行时度量运作数据,并使用该数据来提高进一步重新编译的质量。
可禁用 JIT 编译器,在这种情况下,将解释整个 Java 程序。除诊断或解决 JIT 编译问题外,不推荐禁用 JIT 编译器。
简单来说,JIT会将某些符合条件(比如,频繁的循环)的字节码被编译成目标的机器指令直接执行,从而加快执行速度。可以通过配置
-XX:+PrintCompilation参数,在控制台观察JIT做了哪些优化。当JIT执行优化时,会在终端输出相应的优化信息。我们代码的JIT输出的信息,可以看到我们测试的两个函数已经被JIT编译优化了。
67 46 n 0 sun.misc.Unsafe::getObjectVolatile (native) 67 45 3 java.util.concurrent.ConcurrentHashMap::tabAt (21 bytes) 67 47 3 java.lang.AbstractStringBuilder::<init> (12 bytes) 68 49 3 java.lang.AbstractStringBuilder::expandCapacity (50 bytes) 68 48 3 java.lang.ref.SoftReference::get (29 bytes) 78 50 % ! 3 com.kevin.java.performancetTest.ForTryAndTryFor::forTry @ 8 (73 bytes) 78 51 ! 3 com.kevin.java.performancetTest.ForTryAndTryFor::forTry (73 bytes) 79 52 % ! 4 com.kevin.java.performancetTest.ForTryAndTryFor::forTry @ 8 (73 bytes) 79 50 % ! 3 com.kevin.java.performancetTest.ForTryAndTryFor::forTry @ -2 (73 bytes) made not entrant 131 52 % ! 4 com.kevin.java.performancetTest.ForTryAndTryFor::forTry @ -2 (73 bytes) made not entrant forTry 63 milliseconds 141 53 % ! 3 com.kevin.java.performancetTest.ForTryAndTryFor::tryFor @ 8 (71 bytes) 142 54 ! 3 com.kevin.java.performancetTest.ForTryAndTryFor::tryFor (71 bytes) 142 55 % ! 4 com.kevin.java.performancetTest.ForTryAndTryFor::tryFor @ 8 (71 bytes) 143 53 % ! 3 com.kevin.java.performancetTest.ForTryAndTryFor::tryFor @ -2 (71 bytes) made not entrant 192 55 % ! 4 com.kevin.java.performancetTest.ForTryAndTryFor::tryFor @ -2 (71 bytes) made not entrant tryFor 61 milliseconds- 类加载时间也被统计进来了。
类首次被使用时,会触发类加载,产生了时间消耗。
从上面分析的原因不难看出,为什么绝大多数时候tryFor会比forTry快了。JIT编译耗时和类加载时间会被统计到第一个执行的函数forTry里面。这就直接导致了第一个执行的函数(forTry)要比第二个函数(tryFor)执行的时间要长。最为重要的使用System.currentTimeMillis()测量的是(等待cpu+真正被执行的时间),这就导致出现图1完全与绝大多数测试结果完全相反的情况。
那有什么可以让我们穿过这层层迷雾,直抵真相呢?
穿透迷雾,直抵真相!
- 不要使用System.currentTimeMillis()亦或者使用System.nanoTime()
这里说明一下,可能你会看到有些建议使用System.nanoTime()来测试,但是它跟System.currentTimeMillis()区别,仅仅在于时间的基准不同和精度不同,但都表示的是逝去的时间,所以对于测试执行时间上,并没有什么区别。因为都无法统计CPU真正执行时间。
要测试cpu真正执行时间,这里推荐使用JProfiler性能测试工具,它可以测量出cpu真正的执行时间。具体安装使用方法可以自行google百度。因为这不是本文最终使用的测试方法,所以就不做详细介绍了。但是你使用它来测试上面的代码,至少可以排除等待CPU消耗的时间 - 对于后两者,需要加入Warmup(预热)阶段。
预热阶段就是不断运行你的测试代码,从而使得代码完成初始化工作(类加载),并足以触发JIT编译机制。一般来说,循环几万次就可以预热完毕。
那是不是做到以上两点就可以了直抵真相了?非常不幸,并没有那么简单,JIT机制和JVM并没有想象的这么简单,要做到以下这些点你才能得到比较真实的结果。下面摘录至how-do-i-write-a-correct-micro-benchmark-in-java排名第一的答案
Tips about writing micro benchmarks from the creators of Java
HotSpot:Rule 0: Read a reputable paper on JVMs and micro-benchmarking. A good one is Brian Goetz, 2005. Do not expect too much from
micro-benchmarks; they measure only a limited range of JVM performance
characteristics.Rule 1: Always include a warmup phase which runs your test kernel all the way through, enough to trigger all initializations and
compilations before timing phase(s). (Fewer iterations is OK on the
warmup phase. The rule of thumb is several tens of thousands of inner
loop iterations.)Rule 2: Always run with
-XX:+PrintCompilation,-verbose:gc, etc., so you can verify that the compiler and other parts of the JVM
are not doing unexpected work during your timing phase.Rule 2.1: Print messages at the beginning and end of timing and warmup phases, so you can verify that there is no output from Rule 2
during the timing phase.Rule 3: Be aware of the difference between -client and -server, and OSR and regular compilations. The
-XX:+PrintCompilationflag
reports OSR compilations with an at-sign to denote the non-initial
entry point, for example:Trouble$1::run @ 2 (41 bytes). Prefer
server to client, and regular to OSR, if you are after best
performance.Rule 4: Be aware of initialization effects. Do not print for the first time during your timing phase, since printing loads and
initializes classes. Do not load new classes outside of the warmup
phase (or final reporting phase), unless you are testing class loading
specifically (and in that case load only the test classes). Rule 2 is
your first line of defense against such effects.Rule 5: Be aware of deoptimization and recompilation effects. Do not take any code path for the first time in the timing phase, because
the compiler may junk and recompile the code, based on an earlier
optimistic assumption that the path was not going to be used at all.
Rule 2 is your first line of defense against such effects.Rule 6: Use appropriate tools to read the compiler’s mind, and expect to be surprised by the code it produces. Inspect the code
yourself before forming theories about what makes something faster or
slower.Rule 7: Reduce noise in your measurements. Run your benchmark on a quiet machine, and run it several times, discarding outliers. Use
-Xbatchto serialize the compiler with the application, and consider
setting-XX:CICompilerCount=1to prevent the compiler from running
in parallel with itself.Rule 8: Use a library for your benchmark as it is probably more efficient and was already debugged for this sole purpose. Such as
JMH, Caliper or Bill and Paul’s Excellent UCSD Benchmarks
for Java.
还可以参考Java theory and practice: Anatomy of a flawed microbenchmark
认真看完这些,你就会发现,要保证microbenchmark结果的可靠,真不是一般的难!!!
那就没有简单可靠的测试方法了吗?如果你认真看完上面提到的点,你应该会注意到Rule 8,没错,我就是使用Rule8提到的JMH来。这里摘录一段网上的介绍
JMH是新的microbenchmark(微基准测试)框架(2013年首次发布)。与其他众多框架相比它的特色优势在于,它是由Oracle实现JIT的相同人员开发的。结果可信度很高。
JMH官方主页:http://openjdk.java.net/projects/code-tools/jmh/
正确的测试
测试环境:
JVM版本:
java version "1.8.0_91"
Java(TM) SE Runtime Environment (build 1.8.0_91-b14)
Java HotSpot(TM) 64-Bit Server VM (build 25.91-b14, mixed mode)

系统:
Linux Mint 17.3 Rosa 64bit

配置:i7-4710hq+16g

工具:Intellij IDEA 2016+JMH的jar包+JMH intellij plugin插件具体使用可以看JMH插件Github项目地址,上面有介绍使用细节
测试代码:
package com.kevin.java.performancetTest;

import org.openjdk.jmh.annotations.Benchmark;

/** * Created by kevin on 16-7-10. */
public class ForTryAndTryFor {


    public static void main(String[] args) {
        tryFor();
        forTry();
    }

    @Benchmark
    public static void tryFor() {
        int j = 3;
        try {
            for (int i = 0; i < 1000; i++) {
                Math.sin(j);
            }
        } catch (Exception e) {
            e.printStackTrace();
        }
    }

    @Benchmark
    public static void forTry() {
        int j = 3;
        for (int i = 0; i < 1000; i++) {
            try {
                Math.sin(j);
            } catch (Exception e) {
                e.printStackTrace();
            }
        }
    }
}
测试结果
JMH会做执行一段时间的WarmUp,之后才开始进行测试。这里只是截取结果部分,运行过程输出就不放出来了
# Run complete. Total time: 00:02:41

Benchmark                                 Mode  Cnt   Score   Error   Units
performancetTest.ForTryAndTryFor.forTry  thrpt   40  26.122 ± 0.035  ops/ms
performancetTest.ForTryAndTryFor.tryFor  thrpt   40  25.535 ± 0.087  ops/ms
# Run complete. Total time: 00:02:41
Benchmark Mode Cnt Score Error Units
performancetTest.ForTryAndTryFor.forTry sample 514957 0.039 ± 0.001 ms/op
performancetTest.ForTryAndTryFor.tryFor sample 521559 0.038 ± 0.001 ms/op每个函数都测试了两编,总时长都是2分41秒
主要关注Score和Error两列,±表示偏差。
第一个结果的意思是,每毫秒调用了 26.122 ± 0.035次forTry函数,每毫秒调用了 25.535 ± 0.087次tryFor函数,第二个结果表示的是调用一次函数的时间。
从结果中,可以看到两个函数性能并没有差异,与之前的分析吻合。
最终总结
本文由Try catch与for循环的位置关系开始讨论,通过分析得出了结论,并最终通过测试,验证了分析的结论——两者在没有抛出异常时,是没有区别的。在分析的过程中,我们也了解到try catch的实质,就是跟方法关联的异常表,在抛出异常的时候,这个就决定了异常是否会被该方法处理。
最后回到标题讨论的,try catch对性能的影响。try catch对性能还是有一定的影响,那就是try块会阻止java的优化(例如重排序)。当然重排序是需要一定的条件触发。一般而言,只要try块范围越小,对java的优化机制的影响是就越小。所以保证try块范围尽量只覆盖抛出异常的地方,就可以使得异常对java优化的机制的影响最小化。
还是那句话,先保证代码正确执行,然后在出现明显的性能问题时,再去考虑优化。
参考链接
http://stackoverflow.com/questions/16451777/is-it-expensive-to-use-try-catch-blocks-even-if-an-exception-is-never-thrown
http://stackoverflow.com/questions/504103/how-do-i-write-a-correct-micro-benchmark-in-java
边栏推荐
- 本体开发日记01-Jena配置环境变量
- 4.字符流
- Ontology Development Diary 03-Understanding Code
- Django实现对数据库数据增删改查(一)
- 2048小游戏成品源码
- 约瑟夫问题的学习心得
- 软件测试面试题目:请你列举几个物品的测试方法怎么说?
- 本体开发日记05-努力理解SWRL(上)
- How much do you know about the mobile APP testing process specifications and methods?
- What does the test plan include?What is the purpose and meaning?
猜你喜欢
运行flutter项目时遇到的问题修改flutter为国内镜像

Ovie map computer terminal and mobile terminal can not be used, is there any alternative map tool
lateral view explode的另一种实现方式
软件测试面试中,面试官问你一些比较“刁难”的问题你会怎么回答
"The camera can't be used" + win8.1 + DELL + external camera + USB drive-free solution
软件测试个人求职简历该怎么写,模板在这里
These 12 GIS software are better than the other
栈的实现之用链表实现
MySQL Checking and Filling Leaks (5) Unfamiliar Knowledge Points
自动化测试简历编写应该注意哪方面?有哪些技巧?


随机推荐
运行flutter项目时遇到的问题
MySQL Leak Detection and Filling (3) Calculated Fields
全网最全的软件测试基础知识整理(新手入门必学)
软件测试流程包括哪些内容?测试方法有哪些?
GBase数据库产生迁移工具假死的原因是什么?
接口测试的概念、目的、流程、测试方法有哪些?
Sweet alert
这12个GIS软件一个比一个好用
本体开发日记02-sparql简单查询
seata处理分布式事务
Domestic Google earth, terrain analysis seconds kill with the map software
有返回值的函数
QT sets the icon of the exe executable
Onnx - environment build 】 【 tensorrt
约瑟夫问题的学习心得
1.线程简介
国产谷歌地球,地形分析秒杀同款地图软件
使用Protege4和CO-ODE工具构建OWL本体的实用指南-1.3版本(7.4 Annotation Properties-注释属性)
RPC服务远程漏洞
MySQL lock