Project: Netflix Data Analysis and Visualization with Python

Overview

Project: Netflix Data Analysis and Visualization with Python

MyNetflixDashboard

Table of Contents

  1. General Info
  2. Installation
  3. Demo
  4. Usage and Main Functionalities
  5. Contributing

General Info

This is a compact Data Visualization project I worked on for fun and to deepen my knowledge about visualizations and graphs using python libraries.

From conception and design to every line of code, the entire Dashboard was worked on by myself. During this project, I was able to repeat and deepen what I had previously learned in my Data Science course of study. Especially, I was able to familiarize myself with pandas and work on my data visualization skills, which I greatly enjoied!

The dataset I used for the Netflix data analytics task consists of my personal Netflix data, which I requested through their website. You can get access to your own data through this link. Feel free to download it and use my code to look into your own viewing behaviour :)

Installation

Requirements: Make sure you have Python 3.7+ installed on your computer. You can download the latest version of Python here.

Req. Packages:

  • pandas
  • dash
  • dash_bootstrap_components
  • ploty.express
  • plotly.graph_objects

Demo

Demo_MyNetflixDashboard_komprimiert.mov

Usage and Main Functionalities

Want to know more about your own Netflix behaviour? For test usage you can download your own Netflix data. Just follow this link and Netflix will send you your personal data.

Please also refer to the comments within the code itself to get more information on the functionalities of the program.


0. Preparing the data for analysis

  • This part cleans up the original data and prepares it for analysis.
  • In the process, columns that are not needed are dropped.
  • Time data is converted into appropriate time formats and split into several columns. The days of the week are added.
  • In addition, the titles of the movies/series are split (title, season number, episode name).

1. Analysis

  • This part of the code is about analyzing the data.
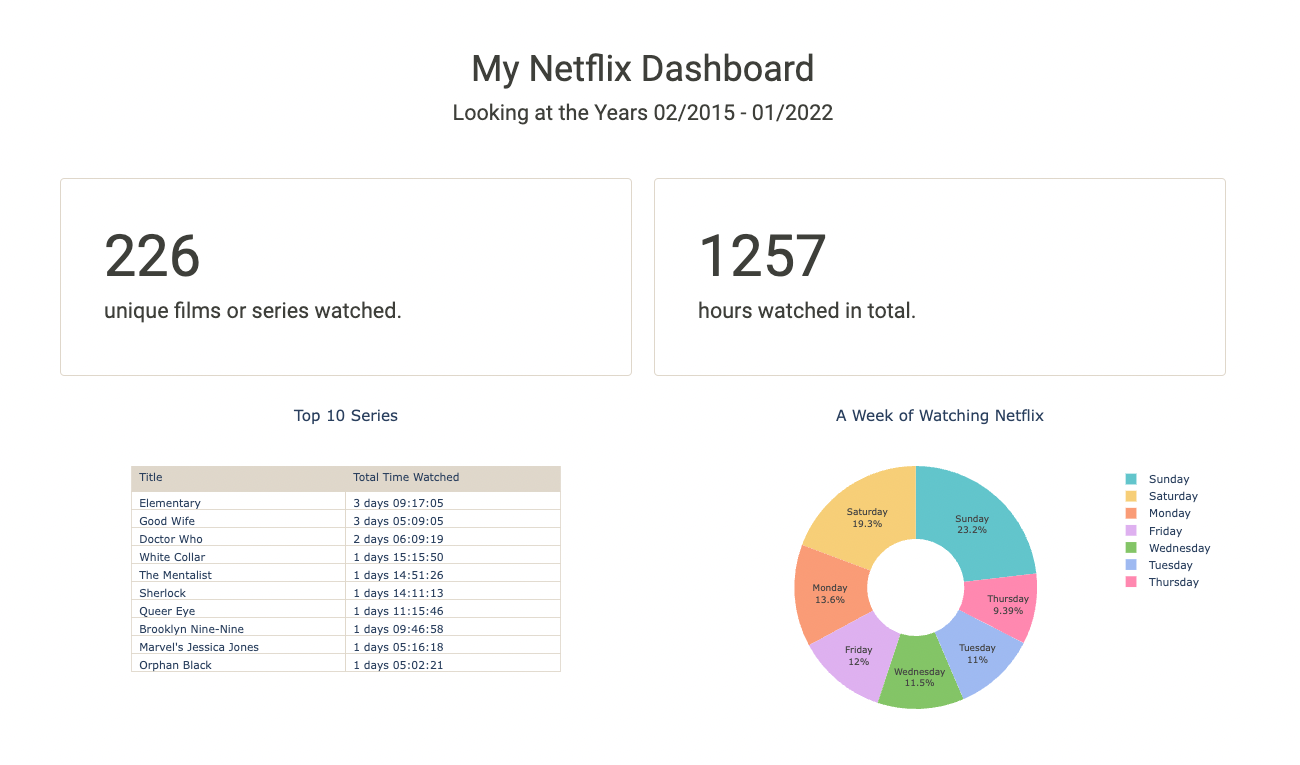
  • We find out how many movies or series were watched over the entire period. We also count the total number of hours Netflix was watched.
  • A pie chart is created that shows which days of the week are watched.
  • In addition, the top 10 series that were watched the longest (in terms of total duration) are displayed.
  • A line chart shows Netflix viewing behavior over the years, counting the total number of hours Netflix was watched.

NetflixOverTime

2. Dash App Layout

  • plotly's Dash is now used to create an Interactive Dashboard of Netflix data.
  • The individual graphics and texts are arranged in rows and containers.
  • This part also includes a dropdown menu that the user can interact with.

3. App Callback

  • Here we connect an interactive bar chart to the Dash Components.
  • The chart represents our total annual hours of Netflix watched, grouped by month. The chart is filterable by year.

MonthlyViews

Contributing

Your comments, suggestions, and contributions are welcome. Please feel free to contribute pull requests or create issues for bugs and feature requests.
Owner
Kathrin Hälbich
Data Science Student and PR- & Marketing-Expert
Kathrin Hälbich
Yet Another Workflow Parser for SecurityHub

YAWPS Yet Another Workflow Parser for SecurityHub "Screaming pepper" by Rum Bucolic Ape is licensed with CC BY-ND 2.0. To view a copy of this license,

myoung34 8 Dec 22, 2022
Open-Domain Question-Answering for COVID-19 and Other Emergent Domains

Open-Domain Question-Answering for COVID-19 and Other Emergent Domains This repository contains the source code for an end-to-end open-domain question

7 Sep 27, 2022
Leverage Twitter API v2 to analyze tweet metrics such as impressions and profile clicks over time.

Tweetmetric Tweetmetric allows you to track various metrics on your most recent tweets, such as impressions, retweets and clicks on your profile. The

Mathis HAMMEL 29 Oct 18, 2022
Snakemake workflow for converting FASTQ files to self-contained CRAM files with maximum lossless compression.

Snakemake workflow: name A Snakemake workflow for description Usage The usage of this workflow is described in the Snakemake Workflow Catalog. If

Algorithms for reproducible bioinformatics (Koesterlab) 1 Dec 16, 2021
Employee Turnover Analysis

Employee Turnover Analysis Submission to the DataCamp competition "Can you help reduce employee turnover?"

Jannik Wiedenhaupt 1 Feb 13, 2022
Find exposed data in Azure with this public blob scanner

BlobHunter A tool for scanning Azure blob storage accounts for publicly opened blobs. BlobHunter is a part of "Hunting Azure Blobs Exposes Millions of

CyberArk 250 Jan 03, 2023
PCAfold is an open-source Python library for generating, analyzing and improving low-dimensional manifolds obtained via Principal Component Analysis (PCA).

PCAfold is an open-source Python library for generating, analyzing and improving low-dimensional manifolds obtained via Principal Component Analysis (PCA).

Burn Research 4 Oct 13, 2022
statDistros is a Python library for dealing with various statistical distributions

StatisticalDistributions statDistros statDistros is a Python library for dealing with various statistical distributions. Now it provides various stati

1 Oct 03, 2021
Desafio proposto pela IGTI em seu bootcamp de Cloud Data Engineer

Desafio Modulo 4 - Cloud Data Engineer Bootcamp - IGTI Objetivos Criar infraestrutura como código Utuilizando um cluster Kubernetes na Azure Ingestão

Otacilio Filho 4 Jan 23, 2022
Performance analysis of predictive (alpha) stock factors

Alphalens Alphalens is a Python Library for performance analysis of predictive (alpha) stock factors. Alphalens works great with the Zipline open sour

Quantopian, Inc. 2.5k Jan 09, 2023
DefAP is a program developed to facilitate the exploration of a material's defect chemistry

DefAP is a program developed to facilitate the exploration of a material's defect chemistry. A large number of features are provided and rapid exploration is supported through the use of autoplotting

6 Oct 25, 2022
Airflow ETL With EKS EFS Sagemaker

Airflow ETL With EKS EFS & Sagemaker (en desarrollo) Diagrama de la solución Imp

1 Feb 14, 2022
Approximate Nearest Neighbor Search for Sparse Data in Python!

Approximate Nearest Neighbor Search for Sparse Data in Python! This library is well suited to finding nearest neighbors in sparse, high dimensional spaces (like text documents).

Meta Research 906 Jan 01, 2023
Analysis scripts for QG equations

qg-edgeofchaos Analysis scripts for QG equations FIle/Folder Structure eigensolvers.py - Spectral and finite-difference solvers for Rossby wave eigenf

Norman Cao 2 Sep 27, 2022
Data Analysis for First Year Laboratory at Imperial College, London.

Data Analysis for First Year Laboratory at Imperial College, London. For personal reference only, and to reference in lab reports and lab books.

Martin He 0 Aug 29, 2022
An ETL framework + Monitoring UI/API (experimental project for learning purposes)

Fastlane An ETL framework for building pipelines, and Flask based web API/UI for monitoring pipelines. Project structure fastlane |- fastlane: (ETL fr

Dan Katz 2 Jan 06, 2022
API>local_db>AWS_RDS - Disclaimer! All data used is for educational purposes only.

APIlocal_dbAWS_RDS Disclaimer! All data used is for educational purposes only. ETL pipeline diagram. Aim of project By creating a fully working pipe

0 Apr 25, 2022
Data Intelligence Applications - Online Product Advertising and Pricing with Context Generation

Data Intelligence Applications - Online Product Advertising and Pricing with Context Generation Overview Consider the scenario in which advertisement

Manuel Bressan 2 Nov 18, 2021
Describing statistical models in Python using symbolic formulas

Patsy is a Python library for describing statistical models (especially linear models, or models that have a linear component) and building design mat

Python for Data 866 Dec 16, 2022
Vaex library for Big Data Analytics of an Airline dataset

Vaex-Big-Data-Analytics-for-Airline-data A Python notebook (ipynb) created in Jupyter Notebook, which utilizes the Vaex library for Big Data Analytics

Nikolas Petrou 1 Feb 13, 2022