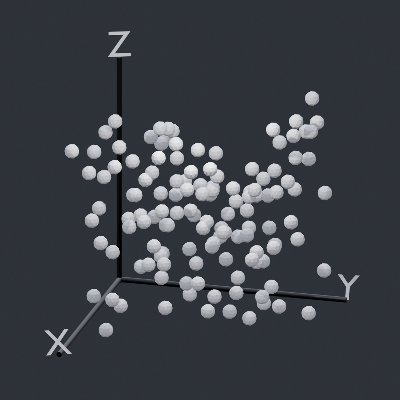
Data-FX is an addon for Blender (2.9) that allows for the visualization of data with different charts

Overview

Data-FX

Data-FX is an addon for Blender (2.9) that allows for the visualization of data with different charts

Currently, there are only 2 chart options...

  • A Scatter plot which plots up to 3 values in 3d space
  • And a "Map plot" that visualizes points on a sphere when given longitudes and latitudes

Below are some examples

How To

Data-FX is located in the View3D sidebar (N -> DataFX)

Simply select the headers from your csv file, edit your settings, and hit generate!

Notable Features

  • Custom duplicate objects (Scatter Plot)
  • Auto axis markers (Scatter Plot)
  • Auto populating .csv header selection (Scatter Plot, Map Plot)
  • Support of Geographic coordinate data (Map Plot)

Planned Features

  • More chart types
  • More supported data types
  • Various chart loading optimizations
  • Global chart menu
You might also like...
Streamlit dashboard examples - Twitter cashtags, StockTwits, WSB, Charts, SQL Pattern Scanner

streamlit-dashboards Streamlit dashboard examples - Twitter cashtags, StockTwits, WSB, Charts, SQL Pattern Scanner Tutorial Video https://ww

mysql relation charts

sqlcharts 自动生成数据库关联关系图 复制settings.py.example 重命名为settings.py 将数据库配置信息填入settings.DATABASE,目前支持mysql和postgresql 执行 python build.py -b,-b是读取数据库表结构,如果只更新匹

Altair extension for saving charts in a variety of formats.

Altair Saver This packge provides extensions to Altair for saving charts to a variety of output types. Supported output formats are: .json/.vl.json: V

🐞 📊 Ladybug extension to generate 2D charts

ladybug-charts Ladybug extension to generate 2D charts. Installation pip install ladybug-charts QuickStart import ladybug_charts API Documentation Loc

GitHub English Top Charts

Help you discover excellent English projects and get rid of the interference of other spoken language.

Simple addon for snapping active object to mesh ground

Snap to Ground Simple addon for snapping active object to mesh ground How to install: install the Python file as an addon use shortcut "D" in 3D view

Apache Superset is a Data Visualization and Data Exploration Platform

Superset A modern, enterprise-ready business intelligence web application. Why Superset? | Supported Databases | Installation and Configuration | Rele

Apache Superset is a Data Visualization and Data Exploration Platform

Apache Superset is a Data Visualization and Data Exploration Platform

Automatic data visualization in atom with the nteract data-explorer

Data Explorer Interactively explore your data directly in atom with hydrogen! The nteract data-explorer provides automatic data visualization, so you

Comments
  • Map Values in Scatter Plot

    Map Values in Scatter Plot

    Currently all values are read from the file and directly translated into their respective positions. Instead of this being hard-coded, the user should be able to choose the size of the graph they want and have the values be mapped to that range.

    enhancement 
    opened by LandonFerg 2
  • Allow Headers in CSV to be Viewed in Plugin

    Allow Headers in CSV to be Viewed in Plugin

    Right now Data-FX only uses numerics to represent the headers you want to select for your x, y and z values for generating a scatter plot. These should be represented instead by their header names to be more human readable.

    opened by LandonFerg 1
Owner
Landon Ferguson
Hello World
Landon Ferguson
Mathematical learnings with Lean, for those of us who wish we knew more of both!

Lean for the Inept Mathematician This repository contains source files for a number of articles or posts aimed at explaining bite-sized mathematical c

Julian Berman 8 Feb 14, 2022
Datapane is the easiest way to create data science reports from Python.

Datapane Teams | Documentation | API Docs | Changelog | Twitter | Blog Share interactive plots and data in 3 lines of Python. Datapane is a Python lib

Datapane 744 Jan 06, 2023
Visualization of numerical optimization algorithms

Visualization of numerical optimization algorithms

Zhengxia Zou 46 Dec 01, 2022
This component provides a wrapper to display SHAP plots in Streamlit.

streamlit-shap This component provides a wrapper to display SHAP plots in Streamlit.

Snehan Kekre 30 Dec 10, 2022
✅ Today I Learn

Today I Learn EDA numpy_100ex numpy_0~10 airline_satisfaction_prediction BERT_naver_movie_classification NLP_prepare NLP_Tweet_Emotion_Recognition tex

Yeonghoo_Ahn 3 Dec 15, 2022
Create SVG drawings from vector geodata files (SHP, geojson, etc).

SVGIS Create SVG drawings from vector geodata files (SHP, geojson, etc). SVGIS is great for: creating small multiples, combining lots of datasets in a

Neil Freeman 78 Dec 09, 2022
Color scales in Python for humans

colorlover Color scales for humans IPython notebook: https://plot.ly/ipython-notebooks/color-scales/ import colorlover as cl from IPython.display impo

Plotly 146 Sep 25, 2022
Simple and fast histogramming in Python accelerated with OpenMP.

pygram11 Simple and fast histogramming in Python accelerated with OpenMP with help from pybind11. pygram11 provides functions for very fast histogram

Doug Davis 28 Dec 14, 2022
A tool for creating Toontown-style nametags in Panda3D

Toontown-Nametag Toontown-Nametag is a tool for creating Toontown Online/Toontown Rewritten-style nametags in Panda3D. It contains a function, createN

BoggoTV 2 Dec 23, 2021
RockNext is an Open Source extending ERPNext built on top of Frappe bringing enterprise ready utilization.

RockNext is an Open Source extending ERPNext built on top of Frappe bringing enterprise ready utilization.

Matheus Breguêz 13 Oct 12, 2022
Designed a greedy algorithm based on Markov sequential decision-making process in MATLAB/Python to optimize using Gurobi solver

Designed a greedy algorithm based on Markov sequential decision-making process in MATLAB/Python to optimize using Gurobi solver, the wheel size, gear shifting sequence by modeling drivetrain constrai

Sabbella Prasanna 1 Jan 11, 2022
Parallel t-SNE implementation with Python and Torch wrappers.

Multicore t-SNE This is a multicore modification of Barnes-Hut t-SNE by L. Van der Maaten with python and Torch CFFI-based wrappers. This code also wo

Dmitry Ulyanov 1.7k Jan 09, 2023
Plotting library for IPython/Jupyter notebooks

bqplot 2-D plotting library for Project Jupyter Introduction bqplot is a 2-D visualization system for Jupyter, based on the constructs of the Grammar

3.4k Dec 29, 2022
The visual framework is designed on the idea of module and implemented by mixin method

Visual Framework The visual framework is designed on the idea of module and implemented by mixin method. Its biggest feature is the mixins module whic

LEFTeyes 9 Sep 19, 2022
Set of matplotlib operations that are not trivial

Matplotlib Snippets This repository contains a set of matplotlib operations that are not trivial. Histograms Histogram with bins adapted to log scale

Raphael Meudec 1 Nov 15, 2021
A simple script that displays pixel-based animation on GitHub Activity

GitHub Activity Animator This project contains a simple Javascript snippet that produces an animation on your GitHub activity tracker. The project als

16 Nov 15, 2021
A Python library for plotting hockey rinks with Matplotlib.

Hockey Rink A Python library for plotting hockey rinks with Matplotlib. Installation pip install hockey_rink Current Rinks The following shows the cus

24 Jan 02, 2023
Learn Data Science with focus on adding value with the most efficient tech stack.

DataScienceWithPython Get started with Data Science with Python An engaging journey to become a Data Scientist with Python TL;DR Download all Jupyter

Learn Python with Rune 110 Dec 22, 2022
Advanced hot reloading for Python

The missing element of Python - Advanced Hot Reloading Details Reloadium adds hot reloading also called "edit and continue" functionality to any Pytho

Reloadware 1.9k Jan 04, 2023
Flexitext is a Python library that makes it easier to draw text with multiple styles in Matplotlib

Flexitext is a Python library that makes it easier to draw text with multiple styles in Matplotlib

Tomás Capretto 93 Dec 28, 2022