Clustergram - Visualization and diagnostics for cluster analysis in Python

Overview

Clustergram

logo clustergram

Visualization and diagnostics for cluster analysis

DOI

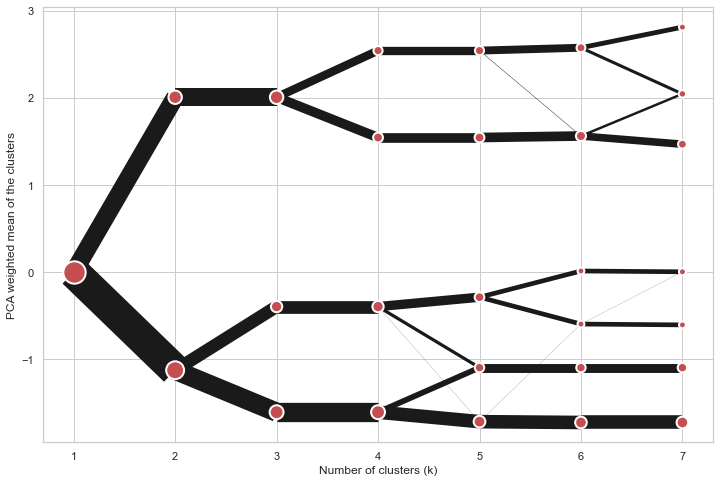
Clustergram is a diagram proposed by Matthias Schonlau in his paper The clustergram: A graph for visualizing hierarchical and nonhierarchical cluster analyses.

In hierarchical cluster analysis, dendrograms are used to visualize how clusters are formed. I propose an alternative graph called a “clustergram” to examine how cluster members are assigned to clusters as the number of clusters increases. This graph is useful in exploratory analysis for nonhierarchical clustering algorithms such as k-means and for hierarchical cluster algorithms when the number of observations is large enough to make dendrograms impractical.

The clustergram was later implemented in R by Tal Galili, who also gives a thorough explanation of the concept.

This is a Python translation of Tal's script written for scikit-learn and RAPIDS cuML implementations of K-Means, Mini Batch K-Means and Gaussian Mixture Model (scikit-learn only) clustering, plus hierarchical/agglomerative clustering using SciPy. Alternatively, you can create clustergram using from_* constructors based on alternative clustering algorithms.

Getting started

You can install clustergram from conda or pip:

conda install clustergram -c conda-forge
pip install clustergram

In any case, you still need to install your selected backend (scikit-learn and scipy or cuML).

The example of clustergram on Palmer penguins dataset:

import seaborn
df = seaborn.load_dataset('penguins')

First we have to select numerical data and scale them.

from sklearn.preprocessing import scale
data = scale(df.drop(columns=['species', 'island', 'sex']).dropna())

And then we can simply pass the data to clustergram.

from clustergram import Clustergram

cgram = Clustergram(range(1, 8))
cgram.fit(data)
cgram.plot()

Default clustergram

Styling

Clustergram.plot() returns matplotlib axis and can be fully customised as any other matplotlib plot.

seaborn.set(style='whitegrid')

cgram.plot(
    ax=ax,
    size=0.5,
    linewidth=0.5,
    cluster_style={"color": "lightblue", "edgecolor": "black"},
    line_style={"color": "red", "linestyle": "-."},
    figsize=(12, 8)
)

Colored clustergram

Mean options

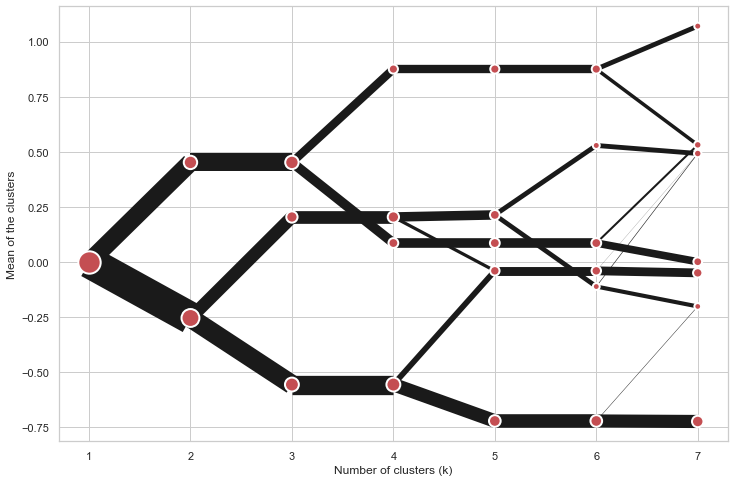
On the y axis, a clustergram can use mean values as in the original paper by Matthias Schonlau or PCA weighted mean values as in the implementation by Tal Galili.

cgram = Clustergram(range(1, 8))
cgram.fit(data)
cgram.plot(figsize=(12, 8), pca_weighted=True)

Default clustergram

cgram = Clustergram(range(1, 8))
cgram.fit(data)
cgram.plot(figsize=(12, 8), pca_weighted=False)

Default clustergram

Scikit-learn, SciPy and RAPIDS cuML backends

Clustergram offers three backends for the computation - scikit-learn and scipy which use CPU and RAPIDS.AI cuML, which uses GPU. Note that all are optional dependencies but you will need at least one of them to generate clustergram.

Using scikit-learn (default):

cgram = Clustergram(range(1, 8), backend='sklearn')
cgram.fit(data)
cgram.plot()

Using cuML:

cgram = Clustergram(range(1, 8), backend='cuML')
cgram.fit(data)
cgram.plot()

data can be all data types supported by the selected backend (including cudf.DataFrame with cuML backend).

Supported methods

Clustergram currently supports K-Means, Mini Batch K-Means, Gaussian Mixture Model and SciPy's hierarchical clustering methods. Note tha GMM and Mini Batch K-Means are supported only for scikit-learn backend and hierarchical methods are supported only for scipy backend.

Using K-Means (default):

cgram = Clustergram(range(1, 8), method='kmeans')
cgram.fit(data)
cgram.plot()

Using Mini Batch K-Means, which can provide significant speedup over K-Means:

cgram = Clustergram(range(1, 8), method='minibatchkmeans', batch_size=100)
cgram.fit(data)
cgram.plot()

Using Gaussian Mixture Model:

cgram = Clustergram(range(1, 8), method='gmm')
cgram.fit(data)
cgram.plot()

Using Ward's hierarchical clustering:

cgram = Clustergram(range(1, 8), method='hierarchical', linkage='ward')
cgram.fit(data)
cgram.plot()

Manual input

Alternatively, you can create clustergram using from_data or from_centers methods based on alternative clustering algorithms.

Using Clustergram.from_data which creates cluster centers as mean or median values:

data = numpy.array([[-1, -1, 0, 10], [1, 1, 10, 2], [0, 0, 20, 4]])
labels = pandas.DataFrame({1: [0, 0, 0], 2: [0, 0, 1], 3: [0, 2, 1]})

cgram = Clustergram.from_data(data, labels)
cgram.plot()

Using Clustergram.from_centers based on explicit cluster centers.:

labels = pandas.DataFrame({1: [0, 0, 0], 2: [0, 0, 1], 3: [0, 2, 1]})
centers = {
            1: np.array([[0, 0]]),
            2: np.array([[-1, -1], [1, 1]]),
            3: np.array([[-1, -1], [1, 1], [0, 0]]),
        }
cgram = Clustergram.from_centers(centers, labels)
cgram.plot(pca_weighted=False)

To support PCA weighted plots you also need to pass data:

cgram = Clustergram.from_centers(centers, labels, data=data)
cgram.plot()

Partial plot

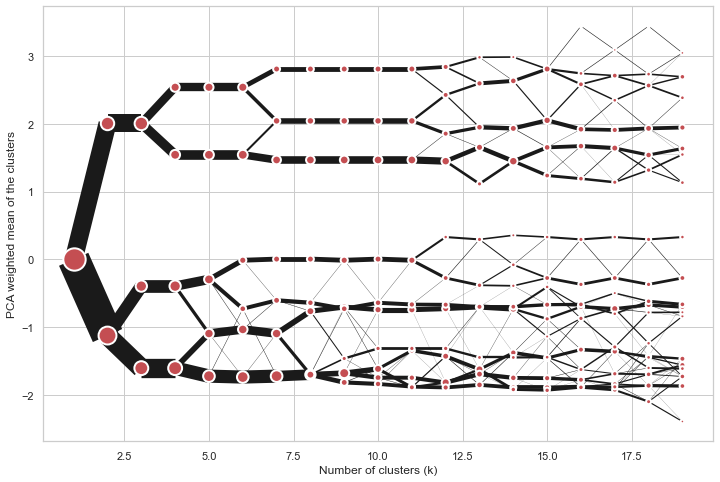
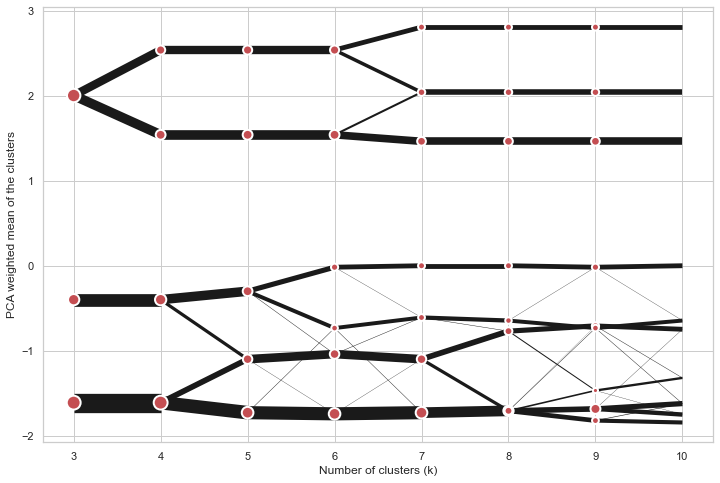
Clustergram.plot() can also plot only a part of the diagram, if you want to focus on a limited range of k.

cgram = Clustergram(range(1, 20))
cgram.fit(data)
cgram.plot(figsize=(12, 8))

Long clustergram

cgram.plot(k_range=range(3, 10), figsize=(12, 8))

Limited clustergram

Additional clustering performance evaluation

Clustergam includes handy wrappers around a selection of clustering performance metrics offered by scikit-learn. Data which were originally computed on GPU are converted to numpy on the fly.

Silhouette score

Compute the mean Silhouette Coefficient of all samples. See scikit-learn documentation for details.

>>> cgram.silhouette_score()
2    0.531540
3    0.447219
4    0.400154
5    0.377720
6    0.372128
7    0.331575
Name: silhouette_score, dtype: float64

Once computed, resulting Series is available as cgram.silhouette. Calling the original method will recompute the score.

Calinski and Harabasz score

Compute the Calinski and Harabasz score, also known as the Variance Ratio Criterion. See scikit-learn documentation for details.

>>> cgram.calinski_harabasz_score()
2    482.191469
3    441.677075
4    400.392131
5    411.175066
6    382.731416
7    352.447569
Name: calinski_harabasz_score, dtype: float64

Once computed, resulting Series is available as cgram.calinski_harabasz. Calling the original method will recompute the score.

Davies-Bouldin score

Compute the Davies-Bouldin score. See scikit-learn documentation for details.

>>> cgram.davies_bouldin_score()
2    0.714064
3    0.943553
4    0.943320
5    0.973248
6    0.950910
7    1.074937
Name: davies_bouldin_score, dtype: float64

Once computed, resulting Series is available as cgram.davies_bouldin. Calling the original method will recompute the score.

Acessing labels

Clustergram stores resulting labels for each of the tested options, which can be accessed as:

>>> cgram.labels
     1  2  3  4  5  6  7
0    0  0  2  2  3  2  1
1    0  0  2  2  3  2  1
2    0  0  2  2  3  2  1
3    0  0  2  2  3  2  1
4    0  0  2  2  0  0  3
..  .. .. .. .. .. .. ..
337  0  1  1  3  2  5  0
338  0  1  1  3  2  5  0
339  0  1  1  1  1  1  4
340  0  1  1  3  2  5  5
341  0  1  1  1  1  1  5

Saving clustergram

You can save both plot and clustergram.Clustergram to a disk.

Saving plot

Clustergram.plot() returns matplotlib axis object and as such can be saved as any other plot:

import matplotlib.pyplot as plt

cgram.plot()
plt.savefig('clustergram.svg')

Saving object

If you want to save your computed clustergram.Clustergram object to a disk, you can use pickle library:

import pickle

with open('clustergram.pickle','wb') as f:
    pickle.dump(cgram, f)

Then loading is equally simple:

with open('clustergram.pickle','rb') as f:
    loaded = pickle.load(f)

References

Schonlau M. The clustergram: a graph for visualizing hierarchical and non-hierarchical cluster analyses. The Stata Journal, 2002; 2 (4):391-402.

Schonlau M. Visualizing Hierarchical and Non-Hierarchical Cluster Analyses with Clustergrams. Computational Statistics: 2004; 19(1):95-111.

https://www.r-statistics.com/2010/06/clustergram-visualization-and-diagnostics-for-cluster-analysis-r-code/

Comments
  • ENH: support interactive bokeh plots

    ENH: support interactive bokeh plots

    Adds Clustergram.bokeh() method which generates clustergram in a form of internactive bokeh plot. On top of an ability to zoom to specific sections shows the count of observations and cluster label (linked to Clustergram.labels).

    To-do:

    • [ ] documentation
    • [x] check RAPIDS compatibility

    I think I'll need to split docs into muliple pages at this point.

    opened by martinfleis 1
  • ENH: from_data and from_centers methods

    ENH: from_data and from_centers methods

    Addind the ability to create clustergram using custom data, without the need to run any cluster algorithm within clustergram itself.

    from_data gets labels and data and creates cluster centers as mean or median values.

    from_centers utilises custom centers when mean/median is not the optimal solution (like in case of GMM for example).

    Closes #10

    opened by martinfleis 1
  • skip k=1 for K-Means

    skip k=1 for K-Means

    k=1 does not need to be modelled, cluster centre is a pure mean of an input array. All the other options require k=1 e.g to fit gaussian.

    Skip k=1 in all k-means implementations to get avoid unnecessary computation.

    opened by martinfleis 0
  • ENH: add bokeh plotting backend

    ENH: add bokeh plotting backend

    With some larger clustergrams it may be quite useful to have the ability to zoom to certain places interactively. I think that bokeh plotting backend would be good for that.

    opened by martinfleis 0
  • ENH: expose labels, refactor plot computation internals, add additional metrics

    ENH: expose labels, refactor plot computation internals, add additional metrics

    Closes #7

    This refactors internals a bit, which in turn allows exposing the actual clustering labels for each tested iteration.

    Aso adding a few additional methods to assess clustering performance on top of clustergram.

    opened by martinfleis 0
  • Support multiple PCAs

    Support multiple PCAs

    The current way of weighting by PCA is hard-coded to use the first one. But it could be useful to see clustergrams weighted by other PCAs as well.

    And it would be super cool to get a 3d version with the first component on one axis and a second one on the other (not sure how useful though :D).

    opened by martinfleis 0
  • Can this work with cluster made by top2vec ?

    Can this work with cluster made by top2vec ?

    Thanks for your interesting package.

    Do you think Clustergram could work with top2vec ? https://github.com/ddangelov/Top2Vec

    I saw that there is the option to create a clustergram from a DataFrame.

    In top2vec, each "document" to cluster is represented as a embedding of a certain dimension, 256 , for example.

    So I could indeed generate a data frame, like this:

    | x0 | x1| ... | x255 | topic | | -----|----|---- | -------| -- | | 0.5| 0.2 | ....| -0.2 | 2 | | 0.7| 0.2 | ....| -0.1 | 2 | | 0.5| 0.2 | ....| -0.2 | 3 |

    Does Clustergram assume anything on the rows of this data frame ? I saw that the from_data method either takes "mean" or "medium" as method to calculate the cluster centers.

    In word vector, we use typically the cosine distance to calculate distances between the vectors. Does this have any influence ?

    top2vec calculates as well the "topic vectors" as a mean of the "document vectors", I believe.

    opened by behrica 17
Releases(v0.6.0)
Owner
Martin Fleischmann
Researcher in geographic data science. Member of @geopandas and @pysal development teams.
Martin Fleischmann
Pytorch Lightning Implementation of SC-Depth Methods.

SC_Depth_pl: This is a pytorch lightning implementation of SC-Depth (V1, V2) for self-supervised learning of monocular depth from video. In the V1 (IJ

JiaWang Bian 216 Dec 30, 2022
pyspark🍒🥭 is delicious,just eat it!😋😋

如何用10天吃掉pyspark? 🔥 🔥 《10天吃掉那只pyspark》 🚀

lyhue1991 578 Dec 30, 2022
Official code implementation for "Personalized Federated Learning using Hypernetworks"

Personalized Federated Learning using Hypernetworks This is an official implementation of Personalized Federated Learning using Hypernetworks paper. [

Aviv Shamsian 121 Dec 25, 2022
A complete, self-contained example for training ImageNet at state-of-the-art speed with FFCV

ffcv ImageNet Training A minimal, single-file PyTorch ImageNet training script designed for hackability. Run train_imagenet.py to get... ...high accur

FFCV 92 Dec 31, 2022
Rethinking of Pedestrian Attribute Recognition: A Reliable Evaluation under Zero-Shot Pedestrian Identity Setting

Pytorch Pedestrian Attribute Recognition: A strong PyTorch baseline of pedestrian attribute recognition and multi-label classification.

Jian 79 Dec 18, 2022
Transfer Learning Shootout for PyTorch's model zoo (torchvision)

pytorch-retraining Transfer Learning shootout for PyTorch's model zoo (torchvision). Load any pretrained model with custom final layer (num_classes) f

Alexander Hirner 169 Jun 29, 2022
On Nonlinear Latent Transformations for GAN-based Image Editing - PyTorch implementation

On Nonlinear Latent Transformations for GAN-based Image Editing - PyTorch implementation On Nonlinear Latent Transformations for GAN-based Image Editi

Valentin Khrulkov 22 Oct 24, 2022
🍷 Gracefully claim weekly free games and monthly content from Epic Store.

EPIC 免费人 🚀 优雅地领取 Epic 免费游戏 Introduction 👋 Epic AwesomeGamer 帮助玩家优雅地领取 Epic 免费游戏。 使用 「Epic免费人」可以实现如下需求: get:搬空游戏商店,获取所有常驻免费游戏与免费附加内容; claim:领取周免游戏及其免

571 Dec 28, 2022
Test-Time Personalization with a Transformer for Human Pose Estimation, NeurIPS 2021

Transforming Self-Supervision in Test Time for Personalizing Human Pose Estimation This is an official implementation of the NeurIPS 2021 paper: Trans

41 Nov 28, 2022
Relative Positional Encoding for Transformers with Linear Complexity

Stochastic Positional Encoding (SPE) This is the source code repository for the ICML 2021 paper Relative Positional Encoding for Transformers with Lin

Antoine Liutkus 48 Nov 16, 2022
tensorrt int8 量化yolov5 4.0 onnx模型

onnx模型转换为 int8 tensorrt引擎

123 Dec 28, 2022
“袋鼯麻麻——智能购物平台”能够精准地定位识别每一个商品

“袋鼯麻麻——智能购物平台”能够精准地定位识别每一个商品,并且能够返回完整地购物清单及顾客应付的实际商品总价格,极大地降低零售行业实际运营过程中巨大的人力成本,提升零售行业无人化、自动化、智能化水平。

thomas-yanxin 192 Jan 05, 2023
DeepSpamReview: Detection of Fake Reviews on Online Review Platforms using Deep Learning Architectures. Summer Internship project at CoreView Systems.

Detection of Fake Reviews on Online Review Platforms using Deep Learning Architectures Dataset: https://s3.amazonaws.com/fast-ai-nlp/yelp_review_polar

Ashish Salunkhe 37 Dec 17, 2022
A curated list of Machine Learning and Deep Learning tutorials in Jupyter Notebook format ready to run in Google Colaboratory

Awesome Machine Learning Jupyter Notebooks for Google Colaboratory A curated list of Machine Learning and Deep Learning tutorials in Jupyter Notebook

Carlos Toxtli 245 Jan 01, 2023
Facebook AI Research Sequence-to-Sequence Toolkit written in Python.

Fairseq(-py) is a sequence modeling toolkit that allows researchers and developers to train custom models for translation, summarization, language mod

20.5k Jan 08, 2023
EMNLP 2021: Single-dataset Experts for Multi-dataset Question-Answering

MADE (Multi-Adapter Dataset Experts) This repository contains the implementation of MADE (Multi-adapter dataset experts), which is described in the pa

Princeton Natural Language Processing 68 Jul 18, 2022
A full-fledged version of Pix2Seq

Stable-Pix2Seq A full-fledged version of Pix2Seq What it is. This is a full-fledged version of Pix2Seq. Compared with unofficial-pix2seq, stable-pix2s

peng gao 205 Dec 27, 2022
Count GitHub Stars ⭐

Count GitHub Stars per Day ⭐ Track GitHub stars per day over a date range to measure the open-source popularity of different repositories. Requirement

Ultralytics 20 Nov 20, 2022
An algorithm that handles large-scale aerial photo co-registration, based on SURF, RANSAC and PyTorch autograd.

An algorithm that handles large-scale aerial photo co-registration, based on SURF, RANSAC and PyTorch autograd.

Luna Yue Huang 41 Oct 29, 2022
This repository contains source code for the Situated Interactive Language Grounding (SILG) benchmark

SILG This repository contains source code for the Situated Interactive Language Grounding (SILG) benchmark. If you find this work helpful, please cons

Victor Zhong 17 Nov 27, 2022