2D maze path solver visualizer implemented with python

Overview

Maze PathFinder Visualizer implemented in Python

How to use

Download:

git clone https://github.com/ss892714028/Maze-PathFinder-Visualization-Python

Install required Libraries

pip install -r requirements.txt

Settings

Go to config.py and change settings.

  • 'w': width of the board
  • 'h': height of the board
  • 'algo':'bfs' for Breadth first search
  • 'algo':'dfs' for Depth first search
  • 'algo':'astar' for A*

Run the visualization

python ./src/drawer.py
  • The first two left clicks on the board initialize start and end node
  • Click or click and drag to create obstacles
  • Press space bar and see the algorithm takes off!

Symbols

  • "@": Start and end node
  • "#": Obstacles
  • "*": Visited node
  • "+": Path

Contributions

All contributions are welcome. :)

Algorithm Implemented

  • BFS (unweighted Dijastra)
  • DFS
  • ASTAR (A*)

Breadth First Search (unweighted Dijkstra)

Breadth First Search is unweighted and guarantee a optimal path. BFS

Depth First Search

Depth First Search is unweighted and does not guarantee a optimal path. DFS

Astar (A*)

A* is weighted and guarantee a optimal path.
A* easy A*

You might also like...
A python visualization of the A* path finding algorithm

A python visualization of the A* path finding algorithm. It allows you to pick your start, end location and make obstacles and then view the process of finding the shortest path. You can also choose to include or exclude diagonal movement.

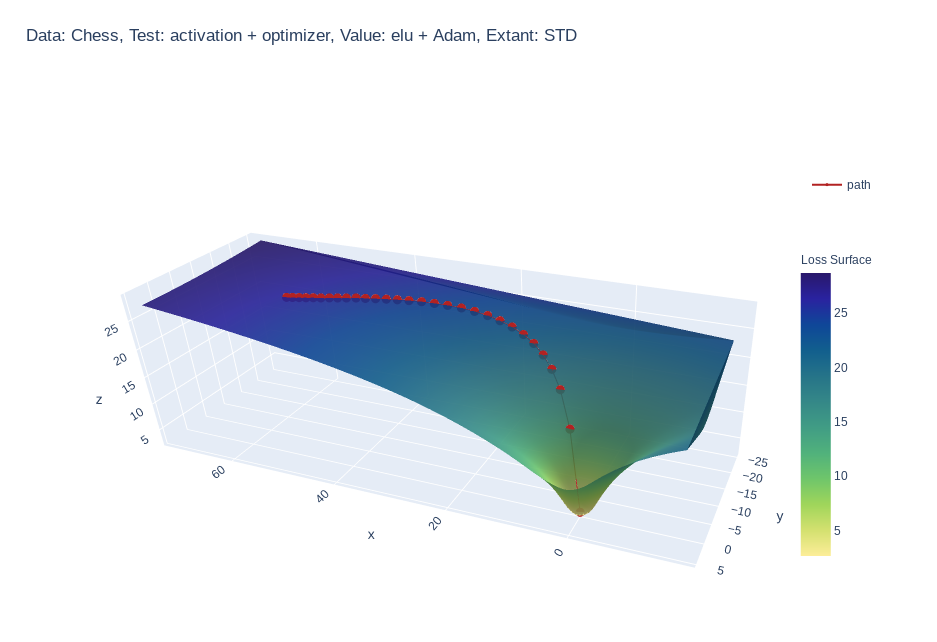
Create 3d loss surface visualizations, with optimizer path. Issues welcome!

MLVTK A loss surface visualization tool Simple feed-forward network trained on chess data, using elu activation and Adam optimizer Simple feed-forward

Fastest Gephi's ForceAtlas2 graph layout algorithm implemented for Python and NetworkX

ForceAtlas2 for Python A port of Gephi's Force Atlas 2 layout algorithm to Python 2 and Python 3 (with a wrapper for NetworkX and igraph). This is the

The visual framework is designed on the idea of module and implemented by mixin method

Visual Framework The visual framework is designed on the idea of module and implemented by mixin method. Its biggest feature is the mixins module whic

Simple plotting for Python. Python wrapper for D3xter - render charts in the browser with simple Python syntax.

PyDexter Simple plotting for Python. Python wrapper for D3xter - render charts in the browser with simple Python syntax. Setup $ pip install PyDexter

Visual Python is a GUI-based Python code generator, developed on the Jupyter Notebook environment as an extension.

Visual Python is a GUI-based Python code generator, developed on the Jupyter Notebook environment as an extension.

A Python Binder that merge 2 files with any extension by creating a new python file and compiling it to exe which runs both payloads.

Update ! ANONFILE MIGHT NOT WORK ! About A Python Binder that merge 2 files with any extension by creating a new python file and compiling it to exe w

Declarative statistical visualization library for Python

Altair http://altair-viz.github.io Altair is a declarative statistical visualization library for Python. With Altair, you can spend more time understa

Interactive Data Visualization in the browser, from  Python
Interactive Data Visualization in the browser, from Python

Bokeh is an interactive visualization library for modern web browsers. It provides elegant, concise construction of versatile graphics, and affords hi

Releases(v0.1)
Data Visualizer Web-Application

Viz-It Data Visualizer Web-Application If I ask you where most of the data wrangler looses their time ? It is Data Overview and EDA. Presenting "Viz-I

Sagnik Roy 17 Nov 20, 2022
Simple CLI python app to show a stocks graph performance. Made with Matplotlib and Tiingo.

stock-graph-python Simple CLI python app to show a stocks graph performance. Made with Matplotlib and Tiingo. Tiingo API Key You will need to add your

Toby 3 May 14, 2022
This is a Cross-Platform Plot Manager for Chia Plotting that is simple, easy-to-use, and reliable.

Swar's Chia Plot Manager A plot manager for Chia plotting: https://www.chia.net/ Development Version: v0.0.1 This is a cross-platform Chia Plot Manage

Swar Patel 1.3k Dec 13, 2022
demir.ai Dataset Operations

demir.ai Dataset Operations With this application, you can have the empty values (nan/null) deleted or filled before giving your dataset to machine le

Ahmet Furkan DEMIR 8 Nov 01, 2022
Histogramming for analysis powered by boost-histogram

Hist Hist is an analyst-friendly front-end for boost-histogram, designed for Python 3.7+ (3.6 users get version 2.4). See what's new. Installation You

Scikit-HEP Project 97 Dec 25, 2022
Painlessly create beautiful matplotlib plots.

Announcement Thank you to everyone who has used prettyplotlib and made it what it is today! Unfortunately, I no longer have the bandwidth to maintain

Olga Botvinnik 1.6k Jan 06, 2023
A Python Library for Self Organizing Map (SOM)

SOMPY A Python Library for Self Organizing Map (SOM) As much as possible, the structure of SOM is similar to somtoolbox in Matlab. It has the followin

Vahid Moosavi 497 Dec 29, 2022
Automatic data visualization in atom with the nteract data-explorer

Data Explorer Interactively explore your data directly in atom with hydrogen! The nteract data-explorer provides automatic data visualization, so you

Ben Russert 65 Dec 01, 2022
Library for exploring and validating machine learning data

TensorFlow Data Validation TensorFlow Data Validation (TFDV) is a library for exploring and validating machine learning data. It is designed to be hig

688 Jan 03, 2023
A tool for creating SVG timelines from simple JSON input.

A tool for creating SVG timelines from simple JSON input.

Jason Reisman 432 Dec 30, 2022
A pandas extension that solves all problems of Jalai/Iraninan/Shamsi dates

Jalali Pandas Extentsion A pandas extension that solves all problems of Jalai/Iraninan/Shamsi dates Features Series Extenstion Convert string to Jalal

51 Jan 02, 2023
GitHub Stats Visualizations : Transparent

GitHub Stats Visualizations : Transparent Generate visualizations of GitHub user and repository statistics using GitHub Actions. ⚠️ Disclaimer The pro

YuanYap 7 Apr 05, 2022
Altair extension for saving charts in a variety of formats.

Altair Saver This packge provides extensions to Altair for saving charts to a variety of output types. Supported output formats are: .json/.vl.json: V

Altair 85 Dec 09, 2022
An intuitive library to add plotting functionality to scikit-learn objects.

Welcome to Scikit-plot Single line functions for detailed visualizations The quickest and easiest way to go from analysis... ...to this. Scikit-plot i

Reiichiro Nakano 2.3k Dec 31, 2022
script to generate HeN ipfs app exports of GLSL shaders

HeNerator A simple script to generate HeN ipfs app exports from any frag shader created with: GlslViewer GlslEditor The Book of Shaders glslCanvas VS

Patricio Gonzalez Vivo 22 Dec 21, 2022
Fractals plotted on MatPlotLib in Python.

About The Project Learning more about fractals through the process of visualization. Built With Matplotlib Numpy License This project is licensed unde

Akeel Ather Medina 2 Aug 30, 2022
Implement the Perspective open source code in preparation for data visualization

Task Overview | Installation Instructions | Link to Module 2 Introduction Experience Technology at JP Morgan Chase Try out what real work is like in t

Abdulazeez Jimoh 1 Jan 23, 2022
股票行情实时数据接口-A股,完全免费的沪深证券股票数据-中国股市,python最简封装的API接口

股票行情实时数据接口-A股,完全免费的沪深证券股票数据-中国股市,python最简封装的API接口,包含日线,历史K线,分时线,分钟线,全部实时采集,系统包括新浪腾讯双数据核心采集获取,自动故障切换,STOCK数据格式成DataFrame格式,可用来查询研究量化分析,股票程序自动化交易系统.为量化研究者在数据获取方面极大地减轻工作量,更加专注于策略和模型的研究与实现。

dev 572 Jan 08, 2023
A python wrapper for creating and viewing effects for Matt Parker's christmas tree.

Christmas Tree Visualizer A python wrapper for creating and viewing effects for Matt Parker's christmas tree. Displays py or csv effect files and allo

4 Nov 22, 2022
Color scales in Python for humans

colorlover Color scales for humans IPython notebook: https://plot.ly/ipython-notebooks/color-scales/ import colorlover as cl from IPython.display impo

Plotly 146 Sep 25, 2022