Tweets your monthly GitHub Contributions as Wordle grid

Overview

wordle-github-contributions

Tweets your monthly GitHub Contributions as Wordle grid

kizie-1488349199779389443

with tweepy support

name: Wordle GitHub Contributions

on:
  schedule:
    # at 08:00 on day-of-month 1
    - cron: "0 8 1 * *"

jobs:
  tweet-contribution-chart:
    runs-on: ubuntu-latest
    steps:
      - uses: actions/[email protected]
      - uses: vchrombie/[email protected]
        env:
          GH_TOKEN: ${{ secrets.GITHUB_TOKEN }}
          TWITTER_CONSUMER_KEY: ${{ secrets.TWITTER_CONSUMER_KEY }}
          TWITTER_CONSUMER_SECRET: ${{ secrets.TWITTER_CONSUMER_SECRET }}
          TWITTER_ACCESS_TOKEN: ${{ secrets.TWITTER_ACCESS_TOKEN }}
          TWITTER_ACCESS_TOKEN_SECRET: ${{ secrets.TWITTER_ACCESS_TOKEN_SECRET }}
You might also like...
Python script for writing text on github contribution chart.

Github Contribution Drawer Python script for writing text on github contribution chart. Requirements Python 3.X Getting Started Create repository Put

Visualise top-rated GitHub repositories in a barchart by keyword

This python script was written for simple purpose -- to visualise top-rated GitHub repositories in a barchart by keyword. Script generates html-page with barchart and information about repository owner, description, create date and update date.

OpenStats is a library built on top of streamlit that extracts data from the Github API and shows the main KPIs

Open Stats Discover and share the KPIs of your OpenSource project. OpenStats is a library built on top of streamlit that extracts data from the Github

Automatically generate GitHub activity!

Commit Bot Automatically generate GitHub activity! We've all wanted to be the developer that commits every day, but that requires a lot of work. Let's

Create Badges with stats of Scratch User, Project and Studio. Use those badges in Github readmes, etc.

Scratch-Stats-Badge Create customized Badges with stats of Scratch User, Studio or Project. Use those badges in Github readmes, etc. Examples Document

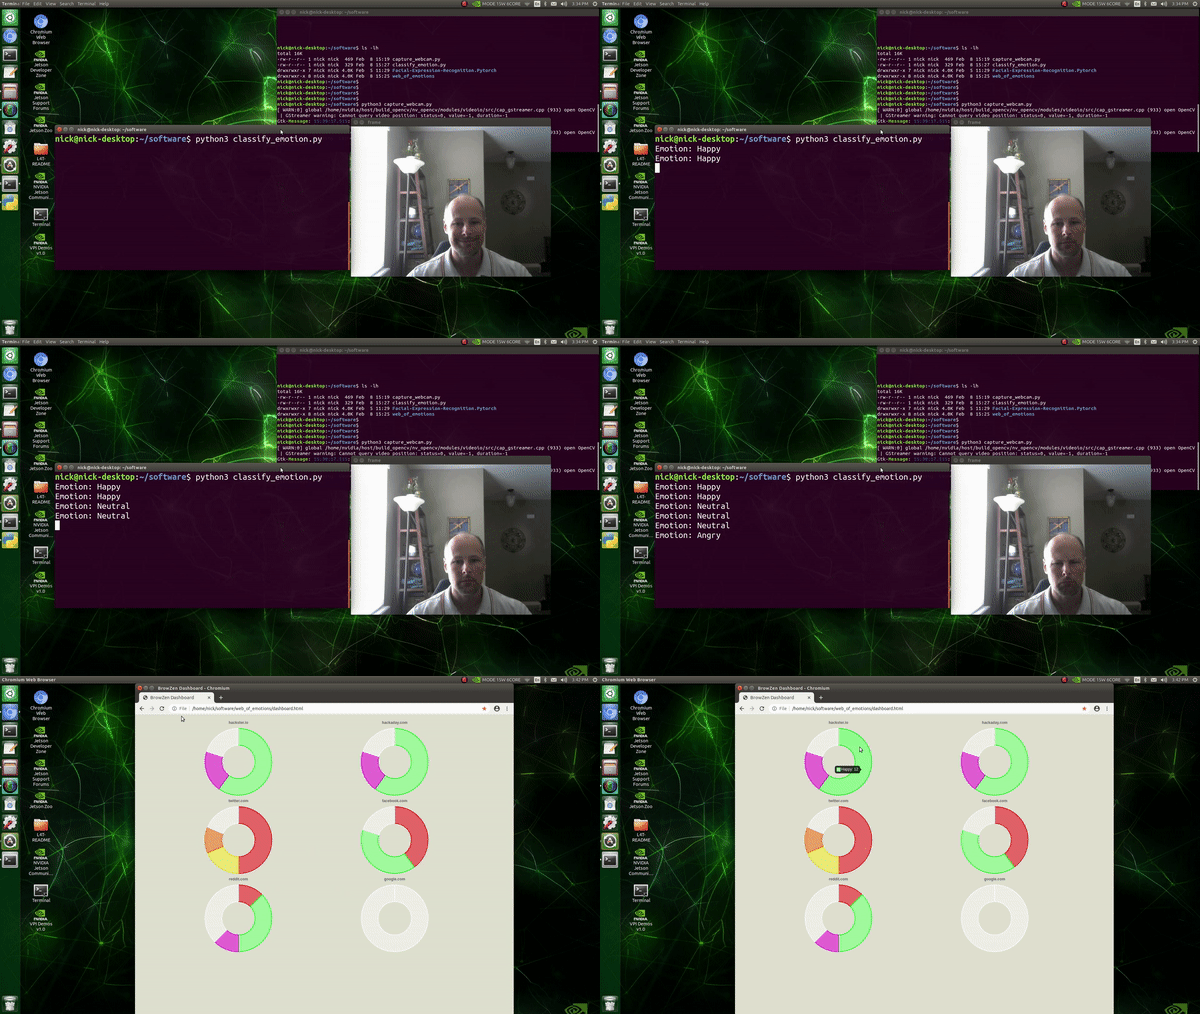
BrowZen correlates your emotional states with the web sites you visit to give you actionable insights about how you spend your time browsing the web.

BrowZen BrowZen correlates your emotional states with the web sites you visit to give you actionable insights about how you spend your time browsing t

An application that allows you to design and test your own stock trading algorithms in an attempt to beat the market.

StockBot is a Python application for designing and testing your own daily stock trading algorithms. Installation Use the

With Holoviews, your data visualizes itself.

HoloViews Stop plotting your data - annotate your data and let it visualize itself. HoloViews is an open-source Python library designed to make data a

With Holoviews, your data visualizes itself.

HoloViews Stop plotting your data - annotate your data and let it visualize itself. HoloViews is an open-source Python library designed to make data a

Releases(v0.2.0)
  • v0.2.0(Feb 15, 2022)

    New Features

    • f7650cb - Add support for adding custom hashtags to the tweet Now, you can add custom hashtags to your tweet. You need to define the hashtags in the workflow configuration file as a string.
            - uses: vchrombie/[email protected]
            with:
              HASHTAGS: 'wordle github contributions'
            env:
              GH_TOKEN: ${{ secrets.GITHUB_TOKEN }}
      

    Full Changelog: https://github.com/vchrombie/wordle-github-contributions/compare/v0.1.0...v0.2.0

    Source code(tar.gz)
    Source code(zip)
  • v0.1.0(Feb 14, 2022)

Owner
Venu Vardhan Reddy Tekula
Data Detective
Venu Vardhan Reddy Tekula
An interactive dashboard built with python that enables you to visualise how rent prices differ across Sweden.

sweden-rent-dashboard An interactive dashboard built with python that enables you to visualise how rent prices differ across Sweden. The dashboard/web

Rory Crean 5 Dec 19, 2021
Simple function to plot multiple barplots in the same figure.

Simple function to plot multiple barplots in the same figure. Supports padding and custom color.

Matthias Jakobs 2 Feb 21, 2022
Movie recommendation using RASA, TigerGraph

Demo run: The below video will highlight the runtime of this setup and some sample real-time conversations using the power of RASA + TigerGraph, Steps

Sudha Vijayakumar 3 Sep 10, 2022
Visualizations of linear algebra algorithms for people who want a deep understanding

Visualising algorithms on symmetric matrices Examples QR algorithm and LR algorithm Here, we have a GIF animation of an interactive visualisation of t

ogogmad 3 May 05, 2022
Visualization Website by using Dash and Heroku

Visualization Website by using Dash and Heroku You can visit the website https://payroll-expense-analysis.herokuapp.com/ In this project, I am interes

YF Liu 1 Jan 14, 2022
Data aggregated from the reports found at the MCPS COVID Dashboard into a set of visualizations.

Montgomery County Public Schools COVID-19 Visualizer Contents About this project Data Support this project About this project Data All data we use can

James 3 Jan 19, 2022
Yata is a fast, simple and easy Data Visulaization tool, running on python dash

Yata is a fast, simple and easy Data Visulaization tool, running on python dash. The main goal of Yata is to provide a easy way for persons with little programming knowledge to visualize their data e

Cybercreek 3 Jun 28, 2021
A tool for creating SVG timelines from simple JSON input.

A tool for creating SVG timelines from simple JSON input.

Jason Reisman 432 Dec 30, 2022
AB-test-analyzer - Python class to perform AB test analysis

AB-test-analyzer Python class to perform AB test analysis Overview This repo con

13 Jul 16, 2022
flask extension for integration with the awesome pydantic package

Flask-Pydantic Flask extension for integration of the awesome pydantic package with Flask. Installation python3 -m pip install Flask-Pydantic Basics v

249 Jan 06, 2023
Visualize large time-series data in plotly

plotly_resampler enables visualizing large sequential data by adding resampling functionality to Plotly figures. In this Plotly-Resampler demo over 11

PreDiCT.IDLab 604 Dec 28, 2022
This is a small repository for me to implement my simply Data Visualisation skills through Python.

Data Visualisations This is a small repository for me to implement my simply Data Visualisation skills through Python. Steam Population Chart from 10/

9 Dec 31, 2021
Tandem Mass Spectrum Prediction with Graph Transformers

MassFormer This is the original implementation of MassFormer, a graph transformer for small molecule MS/MS prediction. Check out the preprint on arxiv

Röst Lab 13 Oct 27, 2022
Simple implementation of Self Organizing Maps (SOMs) with rectangular and hexagonal grid topologies

py-self-organizing-map Simple implementation of Self Organizing Maps (SOMs) with rectangular and hexagonal grid topologies. A SOM is a simple unsuperv

Jonas Grebe 1 Feb 10, 2022
Automatic data visualization in atom with the nteract data-explorer

Data Explorer Interactively explore your data directly in atom with hydrogen! The nteract data-explorer provides automatic data visualization, so you

Ben Russert 65 Dec 01, 2022
https://there.oughta.be/a/macro-keyboard

inkkeys Details and instructions can be found on https://there.oughta.be/a/macro-keyboard In contrast to most of my other projects, I decided to put t

Sebastian Staacks 209 Dec 21, 2022
Generate SVG (dark/light) images visualizing (private/public) GitHub repo statistics for profile/website.

Generate daily updated visualizations of GitHub user and repository statistics from the GitHub API using GitHub Actions for any combination of private and public repositories, whether owned or contri

Adam Ross 2 Dec 16, 2022
CONTRIBUTIONS ONLY: Voluptuous, despite the name, is a Python data validation library.

CONTRIBUTIONS ONLY What does this mean? I do not have time to fix issues myself. The only way fixes or new features will be added is by people submitt

Alec Thomas 1.8k Dec 31, 2022
Political elections, appointment, analysis and visualization in Python

Political elections, appointment, analysis and visualization in Python poli-sci-kit is a Python package for political science appointment and election

Andrew Tavis McAllister 9 Dec 01, 2022
Learning Convolutional Neural Networks with Interactive Visualization.

CNN Explainer An interactive visualization system designed to help non-experts learn about Convolutional Neural Networks (CNNs) For more information,

Polo Club of Data Science 6.3k Jan 01, 2023