Collection of data visualizing projects through Tableau, Data Wrapper, and Power BI

Overview

Data-Visualization-Projects

Collection of data visualizing projects through Tableau, Data Wrapper, and Power BI

Indigenous-Brands-Social-Movements

Python(Pandas, NumPy, Re, Matplotlib), Data Visualization(Data Wrapper)

Selected as a part of competitive UC Berkeley Data Discovery Research Programs, "Indigenous Brands & Social Movements"

  • Cleaned datasets of trademarks owned by Native American Tribes through eliminating unnecessary columns, filling NAs with 0 other values
  • Based on the cleaned datasets, visualized locations of the trademarks on maps through usage of data visualization tool called DataWrapper

Research Program Description

Have you noticed how many brands in the marketplace use indigenous/Native American - oriented terms and imagery? From the notorious Washington Team to the logo on Land of Lakes butter, indigenous imagery and appropriation is everywhere, and worthy of serious study and data analysis. This project aims to bring the work of social movements and activism to a data-intensive study of First Nations brands and trademarks in order to chart a path forward. In this project, we will study how many of these terms are owned by native vs. non-native entities, study how these brands have changed over time, and how the law might be better deployed to protect ownership of indigenously oriented trademarks, and encourage retiring marks that are considered offensive or appropriative.

  • University of California, Berkeley / Data Discovery Research Program Project

Visualization of Homeless in the States using Tableau

Screen Shot 2021-08-18 at 9 07 04 PM

  • Dataset of statistics of homeless from Kaggle and Github

  • This dashboard answers the followings:

    • Which state has the most number of homeless?
    • Is there a difference of the number of homeless between 2012 and 2013?
    • In what state and how many of homeless people of each type(Unsheltered, families, veterans, unaccompanied children, and chronic) are there?
  • This dashboard is composed of the followings:

    • Bubbles of the number of homeless by the States
    • Map of the United States by the number of homeless
    • Stacked bar of the number of homeless for each type with selected State
    • Side-by-Side bar chart of the number of homeless in 2012 and 2013
  • Individual Project by Jinwoo(Roy) Yoon

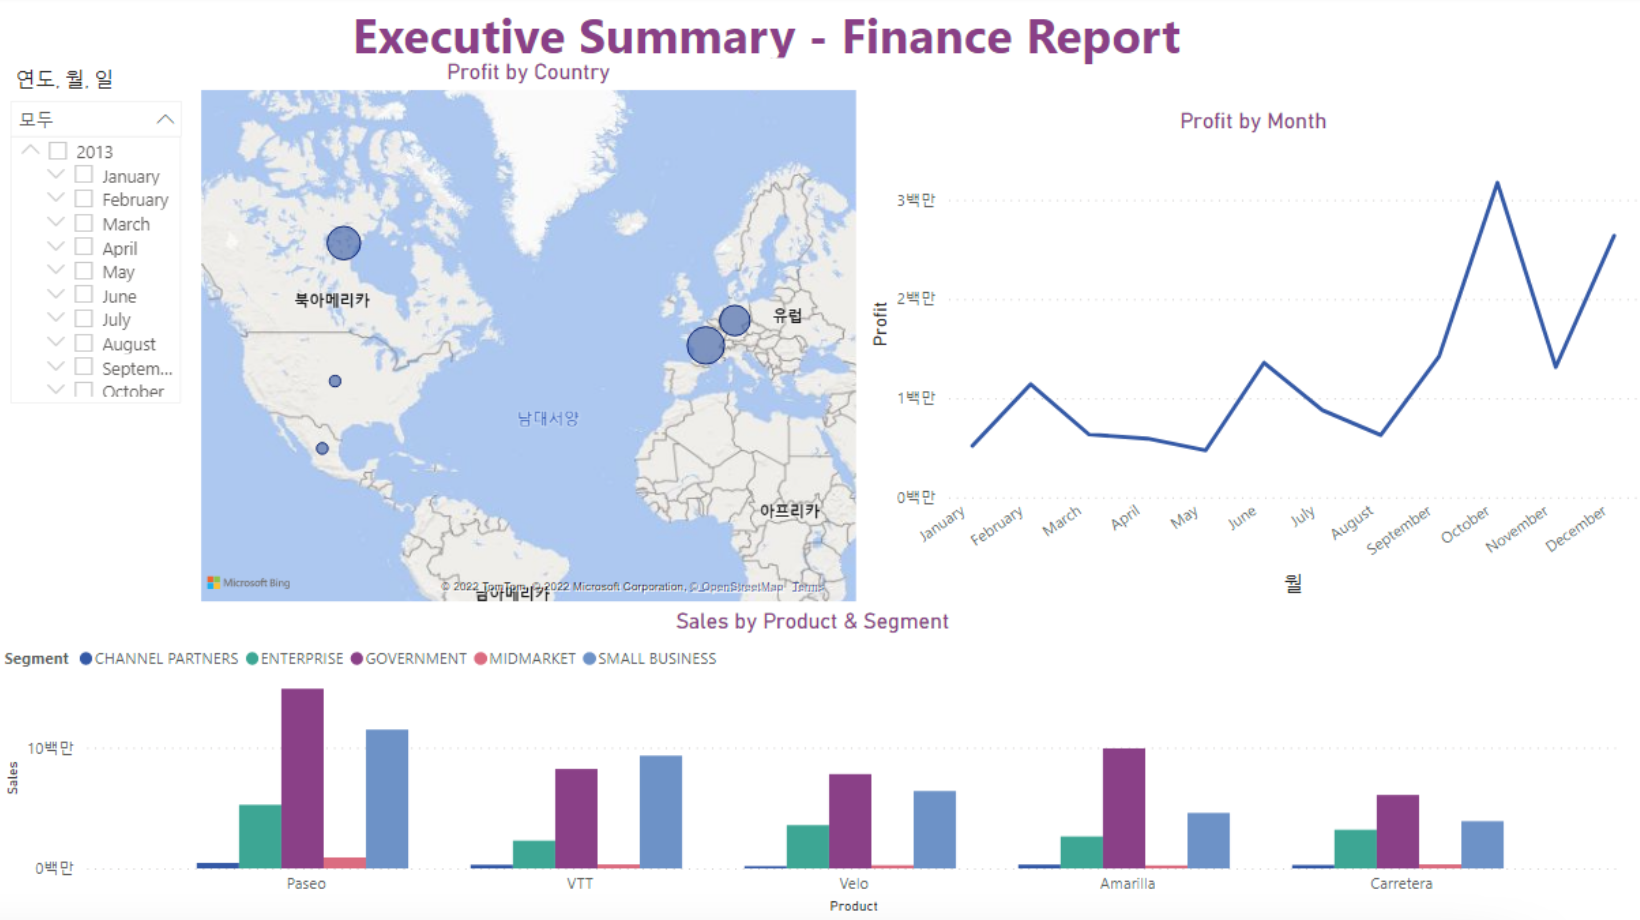
Finance Report using PowerBI

Screen Shot 2022-02-05 at 3 47 12 PM

  • Sample dataset (From Power BI) of a company's sales of products with various countries and dates
  • This dashboard answers the followings:
    • Which month/year was the most profitable?
    • In which country was the most profitable?
    • Which segment should the company invest more?
  • This dashboard is composed of the followings:
    • Map of the North America and Europe showing the amount of sales
    • Graph of profit from sales by months
    • Bar chart of sales by products/segments
  • Individual Project by Jinwoo(Roy) Yoon
Owner
Jinwoo(Roy) Yoon
Rising Senior at University of California, Berkeley Data Science (May 2023)
Jinwoo(Roy) Yoon
python partial dependence plot toolbox

PDPbox python partial dependence plot toolbox Motivation This repository is inspired by ICEbox. The goal is to visualize the impact of certain feature

Li Jiangchun 723 Jan 07, 2023
HiPlot makes understanding high dimensional data easy

HiPlot - High dimensional Interactive Plotting HiPlot is a lightweight interactive visualization tool to help AI researchers discover correlations and

Facebook Research 2.4k Jan 04, 2023
Data-FX is an addon for Blender (2.9) that allows for the visualization of data with different charts

Data-FX Data-FX is an addon for Blender (2.9) that allows for the visualization of data with different charts Currently, there are only 2 chart option

Landon Ferguson 20 Nov 21, 2022
Declarative statistical visualization library for Python

Altair http://altair-viz.github.io Altair is a declarative statistical visualization library for Python. With Altair, you can spend more time understa

Altair 8k Jan 05, 2023
NorthPitch is a python soccer plotting library that sits on top of Matplotlib

NorthPitch is a python soccer plotting library that sits on top of Matplotlib.

Devin Pleuler 30 Feb 22, 2022
Python & Julia port of codes in excellent R books

X4DS This repo is a collection of Python & Julia port of codes in the following excellent R books: An Introduction to Statistical Learning (ISLR) Stat

Gitony 5 Jun 21, 2022
a python function to plot a geopandas dataframe

Pretty GeoDataFrame A minimum python function (~60 lines) to draw pretty geodataframe. Based on matplotlib, shapely, descartes. Installation just use

haoming 27 Dec 05, 2022
Data Analysis: Data Visualization of Airlines

Data Analysis: Data Visualization of Airlines Anderson Cruz | London-UK | Linkedin | Nowa Capital Project: Traffic Airlines Airline Reporting Carrier

Anderson Cruz 1 Feb 10, 2022
Mattia Ficarelli 2 Mar 29, 2022
Python support for Godot 🐍🐍🐍

Godot Python, because you want Python on Godot ! The goal of this project is to provide Python language support as a scripting module for the Godot ga

Emmanuel Leblond 1.4k Jan 04, 2023
Sparkling Pandas

SparklingPandas SparklingPandas aims to make it easy to use the distributed computing power of PySpark to scale your data analysis with Pandas. Sparkl

366 Oct 27, 2022
Automatically visualize your pandas dataframe via a single print! πŸ“Š πŸ’‘

A Python API for Intelligent Visual Discovery Lux is a Python library that facilitate fast and easy data exploration by automating the visualization a

Lux 4.3k Dec 28, 2022
πŸ§‡ Make Waffle Charts in Python.

PyWaffle PyWaffle is an open source, MIT-licensed Python package for plotting waffle charts. It provides a Figure constructor class Waffle, which coul

Guangyang Li 528 Jan 02, 2023
Interactive plotting for Pandas using Vega-Lite

pdvega: Vega-Lite plotting for Pandas Dataframes pdvega is a library that allows you to quickly create interactive Vega-Lite plots from Pandas datafra

Altair 342 Oct 26, 2022
A python-generated website for visualizing the novel coronavirus (COVID-19) data for Greece.

COVID-19-Greece A python-generated website for visualizing the novel coronavirus (COVID-19) data for Greece. Data sources Data provided by Johns Hopki

Isabelle Viktoria Maciohsek 23 Jan 03, 2023
A Jupyter - Three.js bridge

pythreejs A Python / ThreeJS bridge utilizing the Jupyter widget infrastructure. Getting Started Installation Using pip: pip install pythreejs And the

Jupyter Widgets 844 Dec 27, 2022
China and India Population and GDP Visualization

China and India Population and GDP Visualization Historical Population Comparison between India and China This graph shows the population data of Indi

Nicolas De Mello 10 Oct 27, 2021
A way of looking at COVID-19 data that I haven't seen before.

Visualizing Omicron: COVID-19 Deaths vs. Cases Click here for other countries. Data is from Our World in Data/Johns Hopkins University. About this pro

1 Jan 10, 2022
BGraph is a tool designed to generate dependencies graphs from Android.bp soong files.

BGraph BGraph is a tool designed to generate dependencies graphs from Android.bp soong files. Overview BGraph (for Build-Graphs) is a project aimed at

Quarkslab 10 Dec 19, 2022
Some useful extensions for Matplotlib.

mplx Some useful extensions for Matplotlib. Contour plots for functions with discontinuities plt.contour mplx.contour(max_jump=1.0) Matplotlib has pro

Nico SchlΓΆmer 519 Dec 30, 2022