当前位置:网站首页>Recognition of high-speed road signs by Matlab using alexnet
Recognition of high-speed road signs by Matlab using alexnet
2022-04-23 20:21:00 【Install a sound 77】
A classic case of transfer learning ,Alexnet It needs to be downloaded , Download requires registration matlab account number , Of course, this model is also available online , Make yourself at home .
doc Alexnet doc trainFasterRCNNObjectDetector
You can find the case information provided on the official website .

There are also relevant cases on the Internet for reference , Mainly refer to these two :
Of course, the actual use will certainly have bug, It needs to be adjusted slowly .
Just pay attention to the overall format , Just go . It takes up more memory when running .
clc
clear all
load('alexnet.mat',"net")

image = imageDatastore('C:\Users\1\Desktop\matlab_test_net',...
'IncludeSubfolders',true,'LabelSource','foldernames');
layersTransfer=net.Layers(1:end-3);

numClasses = numel(categories(image.Labels));

layers = [

layersTransfer

fullyConnectedLayer(numClasses,'WeightLearnRateFactor',20,'BiasLearnRateFactor',20)

softmaxLayer

classificationLayer];

options = trainingOptions('sgdm', ...
    'MiniBatchSize',5, ...
    'MaxEpochs',20, ...
    'InitialLearnRate',0.0001);


netTransfer = trainNetwork(image,layers,options)
This is basically the default , Just change the photo storage path , Be careful img It's a photo format .
test= load('F:/xunlian/test.mat');     %it is not necessary
options = trainingOptions('sgdm', ...
'InitialLearnRate', 1e-5, ...
'MaxEpochs', 20, ...                     %twenty times   The more training depth is not the better , It could backfire ,
'CheckpointPath', tempdir);
layer=netTransfer.Layers

% Here's the tsst incorrect , It should be a set of arrays , Is not a mat Count .
naq = readtable('test_table_youdian.xls')

% Use table  Combine the data , Instead of importing from the outside

%naqq=table(test.gTruth.DataSource.Source,)
% For this naq To deal with

file = [] ;
aaa = test.gTruth.LabelData.biaozhi;
for i =1:30
    file2=[file;test.gTruth.DataSource.Source{i}];
    %table2array(test.gTruth.LabelData(2,1))

end
file=naq.imageFilename;
naqqq=table(file,aaa)
This data type is mainly made into table type ,
There are two ways One is from mat Put the data in the file and table() Combine
There's another one readtable() read excel Data in , Depending on your personal situation, choose .
The data in this is actually , Path and cut point

Training takes some time ( Add a key point , Need to add one backgroud Folder , Because this model is essentially a classification model , At least two categories are required, that is, there are two data sets , If you encounter this error , Refer to the previous blog )
And then I put this detector Save as mat Format
Then comes the test
img=imread(" picture .jpg")
load('wangluo.mat')
[bbox,score,label] = detect(detector,img);
index = find(score>0.8);
bbox = bbox(index,:);
score = score(index,:);
label = label(index,:);
img = insertObjectAnnotation(img,'Rectangle',bbox,score);
img = insertShape(img,'Rectangle',bbox);
imshow(img)
The test image is shown below :
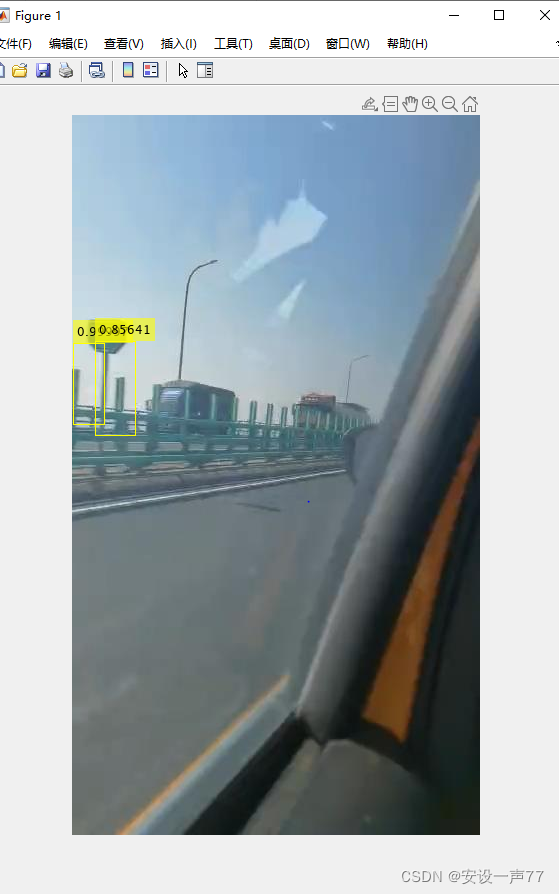
It's rough , But the good thing is that it's simple , convenient , fast ......
Just make do with it , Don't think about publishing a paper .
版权声明
本文为[Install a sound 77]所创,转载请带上原文链接,感谢
https://yzsam.com/2022/04/202204210551491110.html
边栏推荐
- Cadence OrCAD capture batch change component packaging function introduction graphic tutorial and video demonstration
- SIGIR'22「微软」CTR估计:利用上下文信息促进特征表征学习
- nc基础用法
- NC basic usage
- JDBC tool class jdbcfiledateutil uploads files and date format conversion, including the latest, simplest and easiest way to upload single files and multiple files
- How about CICC fortune? Is it safe to open an account
- DNS cloud school | analysis of hidden tunnel attacks in the hidden corner of DNS
- selenium.common.exceptions.WebDriverException: Message: ‘chromedriver‘ executable needs to be in PAT
- nc基础用法3
- Redis cache penetration, cache breakdown, cache avalanche
猜你喜欢
【PTA】L1-002 打印沙漏
DNS cloud school | analysis of hidden tunnel attacks in the hidden corner of DNS
Monte Carlo py solves the area problem! (save pupils Series)

波场DAO新物种下场,USDD如何破局稳定币市场?

On BIM data redundancy theory
JDBC tool class jdbcfiledateutil uploads files and date format conversion, including the latest, simplest and easiest way to upload single files and multiple files

WordPress plug-in: WP CHINA Yes solution to slow domestic access to the official website
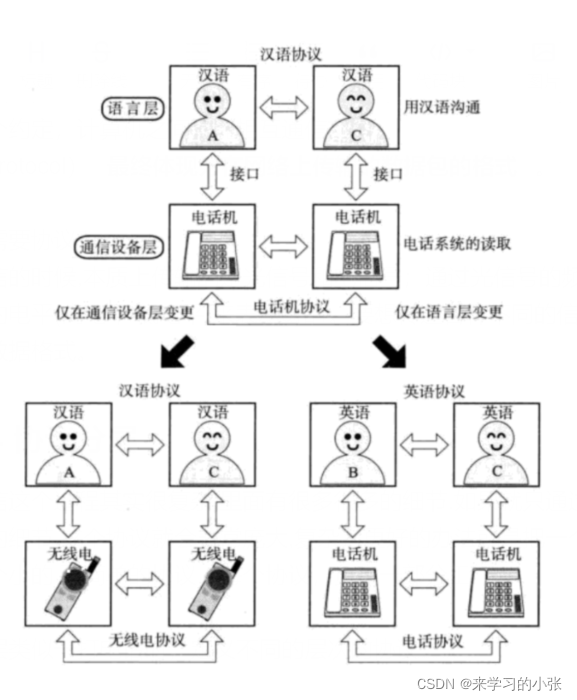
网络通信基础(局域网、广域网、IP地址、端口号、协议、封装、分用)
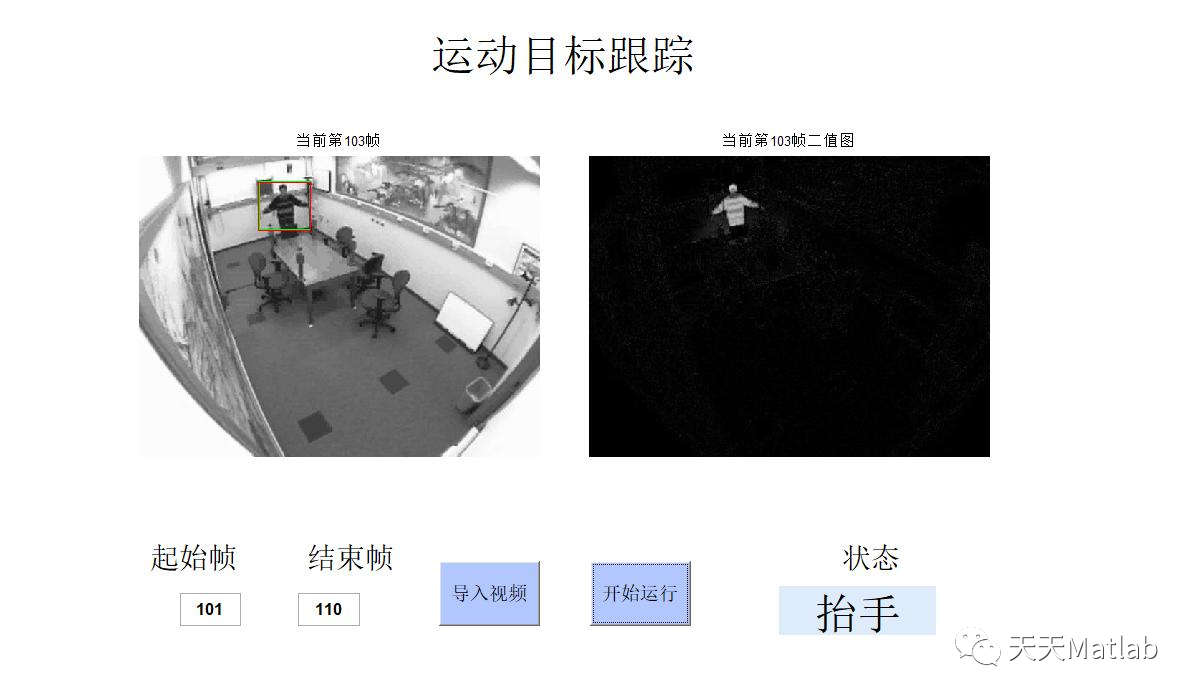
【目标跟踪】基于帧差法结合卡尔曼滤波实现行人姿态识别附matlab代码

PIP installation package reports an error. Could not find a version that satisfies the requirement pymysql (from versions: none)
随机推荐
NC basic usage 3
NC basic usage 2
【问题解决】‘ascii‘ codec can‘t encode characters in position xx-xx: ordinal not in range(128)
R语言ggplot2可视化:ggplot2可视化散点图并使用geom_mark_ellipse函数在数据簇或数据分组的数据点周围添加椭圆进行注释
Automatically fill in body temperature and win10 task plan
JDBC tool class jdbcfiledateutil uploads files and date format conversion, including the latest, simplest and easiest way to upload single files and multiple files
Livego + ffmpeg + RTMP + flvjs to realize live video
Servlet learning notes
論文寫作 19: 會議論文與期刊論文的區別
nc基础用法
Wave field Dao new species end up, how does usdd break the situation and stabilize the currency market?
使用 WPAD/PAC 和 JScript在win11中进行远程代码执行
R language uses timeroc package to calculate the multi time AUC value of survival data under competitive risk, uses Cox model and adds covariates, and R language uses the plotauccurve function of time
PCL点云处理之计算两平面交线(五十一)
PostgreSQL basic functions
STM32 Basics
Handwritten Google's first generation distributed computing framework MapReduce
. Ren -- the intimate artifact in the field of vertical Recruitment!
R语言survival包coxph函数构建cox回归模型、ggrisk包ggrisk函数和two_scatter函数可视化Cox回归的风险评分图、解读风险评分图、基于LIRI数据集(基因数据集)
Solution to PowerDesigner's failure to connect to MySQL in x64 system