当前位置:网站首页>SECURITY DAY04 (Prometheus server, Prometheus monitored terminal, Grafana, monitoring database)
SECURITY DAY04 (Prometheus server, Prometheus monitored terminal, Grafana, monitoring database)
2022-08-11 07:00:00 【zoujiangMr】
Case 1: Prometheus monitoring server
Case 2: Prometheus monitored terminal
Case 3: grafana visualized monitoring data
Case 4: Monitoring database
1 Case 1: Prometheus Monitoring Server
1.1 Problem
This case requires the deployment of a prometheus monitoring server to complete the following tasks:
Install monitoring serverModify the configuration fileWrite service files to manage servicesView monitoring data1.2 Scheme
The experiment requires 2 virtual machines, and the host information is shown in Table-1.
All host systems are CentOS7, and the IP, hostname, and system YUM source are configured in advance.
Table-1 Experimental topology (NIC name is for reference only, can not be copied)
The experimental topology is shown in Figure-1.
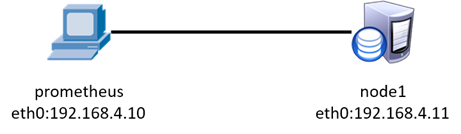
Figure-1
1.3 Steps
The following steps are required to implement this case.
Step 1: Install monitoring software (192.168.4.10 host operation)
1) Install the software (the software package is provided in the material prometheus_soft.tar.gz).
The software needs to be copied to the virtual machine in advance.Unzip it to use.
[边栏推荐
猜你喜欢
随机推荐
Threatless Technology-TVD Daily Vulnerability Intelligence-2022-7-18
文本三剑客——grep过滤
Vulnhub靶机--DC8
Django QuerySet.order_by() SQL注入漏洞复现
SECURITY DAY02( Zabbix报警机制 、 Zabbix进阶操作 、 监控案例)
SECURITY DAY01(监控概述 、 Zabbix基础 、 Zabbix监控服 )
无胁科技-TVD每日漏洞情报-2022-7-25
2022年全国职业技能大赛网络安全竞赛试题B模块自己解析思路(9)
文本三剑客——awk 截取+过滤+统计
web网络安全笔记
网络安全学习小结--kali基本工具、webshell、代码审计
mysql 中登录报错:ERROR 1045 (28000): Access denied for user ‘root‘@‘localhost‘ (using password: YES)ERROR
CLUSTER DAY04(块存储应用案例 、 分布式文件系统 、 对象存储)
lvm 多盘挂载,合并使用
文本三剑客——sed 修改、替换
2022年全国职业技能大赛网络安全竞赛试题B模块自己解析思路(2)
中国移动通信集团有限公司:业务委托书
AUTOMATION DAY07( Ansible Vault 、 普通用户使用ansible)
Threatless Technology-TVD Daily Vulnerability Intelligence-2022-7-27
2022年全国职业技能大赛网络安全竞赛试题B模块自己解析思路(3)